es 性能分析 profile

在使用ES的过程中,有的搜索请求的响应可能比较慢,其中大部分的原因是DSL的执行逻辑有问题。

ES提供了profile功能,该功能详细地列出了搜索时每一个步骤的耗时,可以帮助用户对DSL的性能进行剖析。

开启profile功能只需要在一个正常的搜索请求的DSL中添加"profile":"true"即可。以下查询将开启profile功能:

{
  "profile": "true", //打开性能剖析开关 
  "query": { //查询条件 
    "match": {
      "title": "金都"
    }
  }
}

执行以上DSL后ES返回了一段比较冗长的信息,下面是省略一些信息的返回数据。

{ 
    "took":2, 
    "timed_out":false, 
    "_shards":…, 
    "hits":…, 
   "profile":{                                        //命中的分片信息 
        "shards":[ 
            { 
                "id":"[N533dYYvQWeYoRSPjpo8EA][hotel][0]", 
                "searches":[ 
                    { 
                        "query":[ 
                            {  //在title中搜索“金都”,被ES拆分成两个子查询 
                                "type":"BooleanQuery", 
                                "description":"title:金 title:都", 
                                "time_in_nanos":311540, //match搜索的总耗时 
                                "breakdown":{ 
                                    "set_min_competitive_score_count":0, 
                                    "match_count":3,  //命中的文档个数 
                                    "shallow_advance_count":0, 
                                    "set_min_competitive_score":0, 
                                    "next_doc":11689, 
                                    "match":1833, 
                                    "next_doc_count":3, 
                                    "score_count":3,  //打分的文档个数 
                                    "compute_max_score_count":0, 
                                    "compute_max_score":0, 
                                    "advance":46290, 
                                    "advance_count":1, 
                                    "score":9070, 
                                    "build_scorer_count":2, 
                                    "create_weight":137353, 
                                    "shallow_advance":0, 
                                    "create_weight_count":1, 
                                    "build_scorer":105305 
                                }, 
                                "children":[    //子查询 
                                    {           //子查询"title:金" 
                                        "type":"TermQuery", 
                                        "description":"title:金", 
                                        "time_in_nanos":123649,  //耗时 
                                        "breakdown":Object{…} 
                                    }, 
                                    {               //子查询"title:都" 
                                        "type":"TermQuery", 
                                        "description":"title:都", 
                                        "time_in_nanos":29648, 
                                        "breakdown":Object{…} 
                                    } 
                                ] 
                            } 
                        ], 
                        "rewrite_time":12001, 
                        "collector":[                //ES 收集数据性能剖析 
                            { 
                                "name":"SimpleTopScoreDocCollector", 
                                "reason":"search_top_hits", 
                                "time_in_nanos":18004 //ES收集数据的耗时 
                            } 
                        ] 
                    } 
                ], 
                "aggregations":… //聚合性能剖析,本次搜索无聚合,因此数据为空 
            } 
        ] 
    } 
} 

如上所示,在带有profile的返回信息中,除了包含搜索结果外,还包含profile子句,在该子句中展示了搜索过程中各个环节的名称及耗时情况。

需要注意的是,使用profile功能是有资源损耗的,建议用户只在前期调试的时候使用该功能,在生产中不要开启profile功能。

上面只是一个很简单的例子,如果查询比较复杂或者命中的分片比较多,profile返回的信息将特别冗长。在这种情况下,用户进行性能剖析的效率将非常低。

为此,Kibana提供了可视化的profile功能,该功能建立在ES的profile功能基础上。在Kibana的Dev Tools界面中单击Search Profiler链接,就可以使用可视化的profile了,其区域布局如图所示。

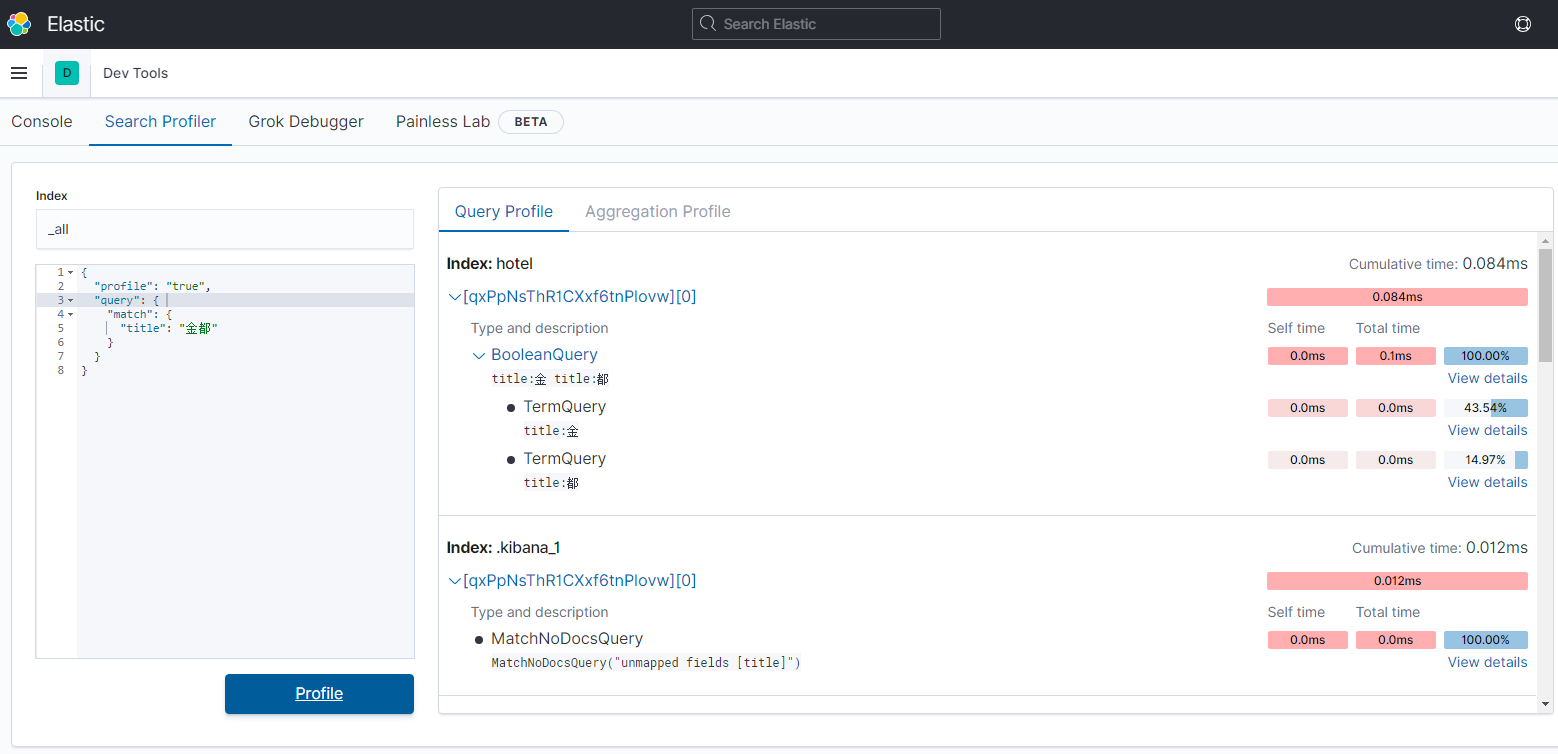
文章来源:Elasticsearch搜索引擎构建入门与实战 --> 4.1.4 性能分析

原文地址:https://www.cnblogs.com/ooo0/p/15638886.html