源码结构和打包
源码使用webpack打包,查看文件webpack.config.js可知,将echarts源码编译成三个版本,分别为常用版本,精简版本,完整版本,分别对应webpack入口文件为:index.common.js、index.simple.js、index.js。
执行命令:
npm install //安装所有依赖包
webpack //打包
web pack -p//打包成压缩包(.min.js)
最后生成的文件在dist文件夹下
源码结构
charts是指各种类型的图表,例如line,bar,pie等,在配置项中指的是series对应的配置
components组件是在配置项中除了serie的其余项,例如title,legend,toobox等
源码的重要目录及说明如下(注:dist为编译后生成的文件夹)
extension (扩展中使用)
lib (源码中没有,执行webpack编译后才存在)
map (世界地图,中国地图及中国各个省份地图的js和json两种格式的文件)
src (核心源码)
test (示例demo)
theme (主题)
入口
使用init方法进行初始化

echarts.init = function(dom, theme, opts) {
if (__DEV__) {//是否是debug模式
//... //错误判断这部分内容省略
}

var chart = new ECharts(dom, theme, opts);//实例化ECharts
chart.id = 'ec_' + idBase++;//chart实例的id号,唯一,逐一递增
instances[chart.id] = chart;//唯一instance(实例)对象

dom.setAttribute &&
dom.setAttribute(DOM_ATTRIBUTE_KEY, chart.id);//为外层dom设置了一个属性,属性值等于chart.id

enableConnect(chart);//按照顺序更新状态,一共三个状态
/*var STATUS_PENDING = 0;
var STATUS_UPDATING = 1;
var STATUS_UPDATED = 2;*/

return chart;
};
参数说明:
/**
* @param {HTMLDomElement} dom 实例容器,一般是一个具有高宽的div元素
* @param {Object} [theme] 主题(说明见下面)
* @param {Object} opts 配置属性,下面几个属性
* @param {number} [opts.devicePixelRatio] Use window.devicePixelRatio by default
* @param {string} [opts.renderer] Currently only 'canvas' is supported.
* @param {number} [opts.width] Use clientWidth of the input `dom` by default.
* Can be 'auto' (the same as null/undefined)
* @param {number} [opts.height] Use clientHeight of the input `dom` by default.
* Can be 'auto' (the same as null/undefined)
*/
主题theme

/*theme主题,可以在官网下载(http://echarts.baidu.com/download-theme.html),或者自己构建
* 使用:
* <script src="theme/vintage.js"></script>
* <script>
* // 第二个参数可以指定前面引入的主题
* var chart = echarts.init(document.getElementById('main'), 'vintage');
* </script>
*/
使用:
var chart = echarts.init(document.getElementById('main'), null, {
renderer: 'canvas'});
构造函数
function ECharts(dom, theme, opts) {
opts = opts || {};
if (typeof theme === 'string') {
theme = themeStorage[theme];
}
this.id;
this.group;
this._dom = dom;
var zr = this._zr = zrender.init(dom, {
renderer: opts.renderer || 'canvas',
devicePixelRatio: opts.devicePixelRatio,
 opts.width,
height: opts.height
});//构造函数第三个参数使用的zrender处理的

this._throttledZrFlush = throttle.throttle(zrUtil.bind(zr.flush, zr), 17);
this._theme = zrUtil.clone(theme);
this._chartsViews = [];//存储所有的charts,为后面便利该变量渲染之
this._chartsMap = {};
this._componentsViews = [];//存储配置项组件的属性,为后面便利该变量渲染之
this._componentsMap = {};
this._api = new ExtensionAPI(this);
//this._api是有'getDom', 'getZr', 'getWidth', 'getHeight', 'dispatchAction', 'isDisposed',
//'on', 'off', 'getDataURL', 'getConnectedDataURL', 'getModel', 'getOption'方法的对象
this._coordSysMgr = new CoordinateSystemManager();
Eventful.call(this);
this._messageCenter = new MessageCenter();
this._initEvents();//初始化鼠标事件
this.resize = zrUtil.bind(this.resize, this);

this._pendingActions = [];
function prioritySortFunc(a, b) {
return a.prio - b.prio;
}
timsort(visualFuncs, prioritySortFunc);
timsort(dataProcessorFuncs, prioritySortFunc);
zr.animation.on('frame', this._onframe, this);
}
echarts使用小案例(分析源码要先会使用嘛,就在官网案例基础上自己改代码写了个渐变南丁格尔玫瑰图表)
效果图:
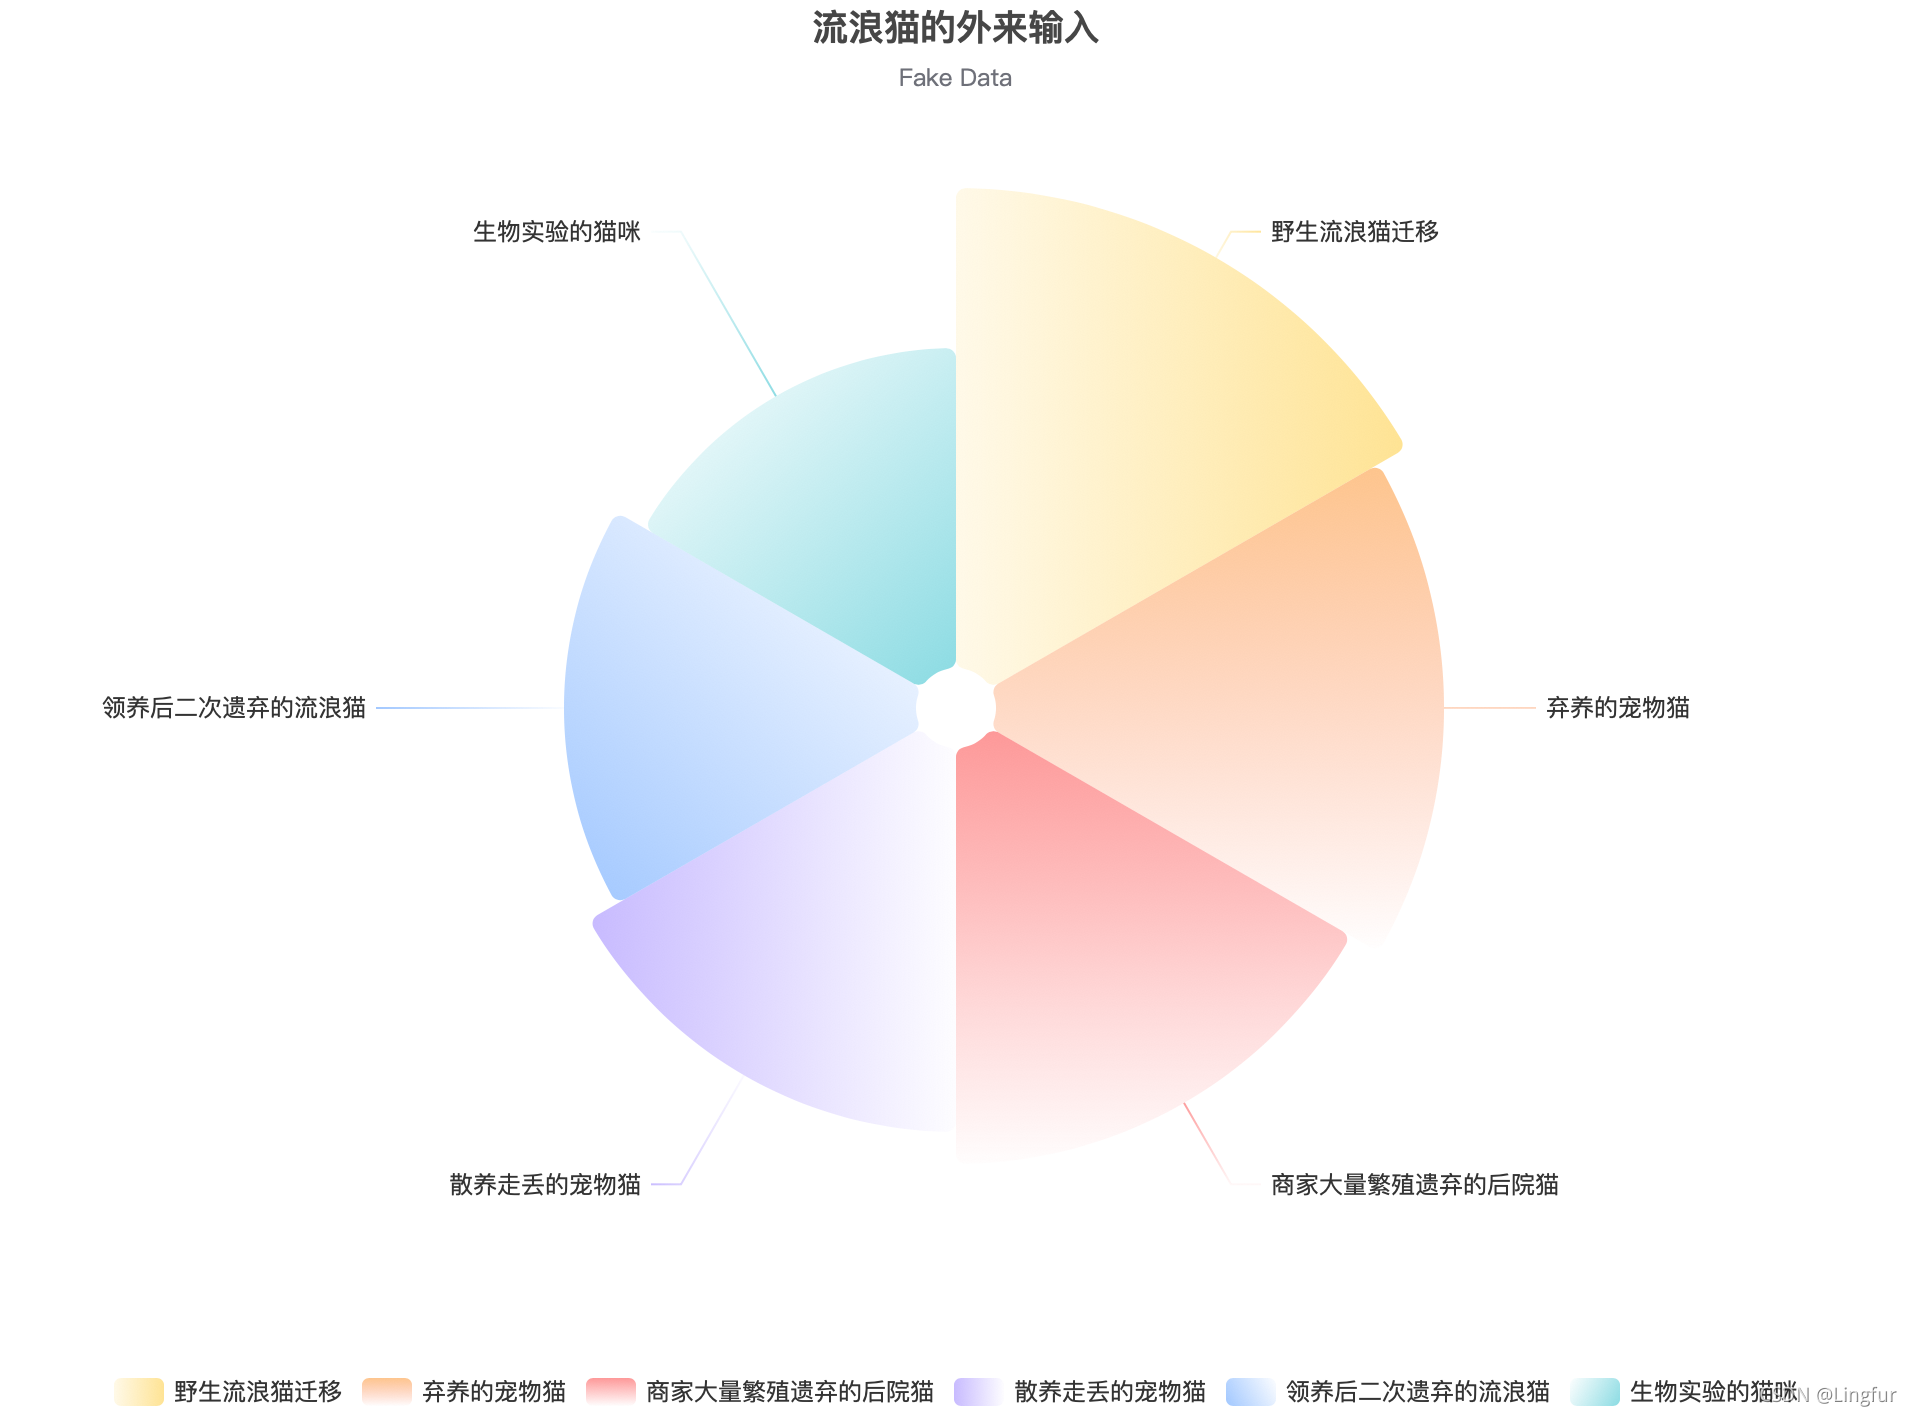
源码:直接在网页修改实时生成即可Examples - Apache ECharts
var colorList = [{
type: 'linear',
x: 0,
y: 0,
x2: 1,
y2: 1,
colorStops: [{
offset: 0,
color: 'rgba(51,192,205,0.01)' // 0% 处的颜色
},
{
offset: 1,
color: 'rgba(51,192,205,0.57)' // 100% 处的颜色
}
],
globalCoord: false // 缺省为 false
},
{
type: 'linear',
x: 1,
y: 0,
x2: 0,
y2: 1,
colorStops: [{
offset: 0,
color: 'rgba(115,172,255,0.02)' // 0% 处的颜色
},
{
offset: 1,
color: 'rgba(115,172,255,0.67)' // 100% 处的颜色
}
],
globalCoord: false // 缺省为 false
},
{
type: 'linear',
x: 1,
y: 0,
x2: 0,
y2: 0,
colorStops: [{
offset: 0,
color: 'rgba(158,135,255,0.02)' // 0% 处的颜色
},
{
offset: 1,
color: 'rgba(158,135,255,0.57)' // 100% 处的颜色
}
],
globalCoord: false // 缺省为 false
},
{
type: 'linear',
x: 0,
y: 1,
x2: 0,
y2: 0,
colorStops: [{
offset: 0,
color: 'rgba(252,75,75,0.01)' // 0% 处的颜色
},
{
offset: 1,
color: 'rgba(252,75,75,0.57)' // 100% 处的颜色
}
],
globalCoord: false // 缺省为 false
},
{
type: 'linear',
x: 1,
y: 1,
x2: 1,
y2: 0,
colorStops: [{
offset: 0,
color: 'rgba(253,138,106,0.01)' // 0% 处的颜色
},
{
offset: 1,
color: '#FDB36ac2' // 100% 处的颜色
}
],
globalCoord: false // 缺省为 false
},
{
type: 'linear',
x: 0,
y: 0,
x2: 1,
y2: 0,
colorStops: [{
offset: 0,
color: 'rgba(254,206,67,0.12)' // 0% 处的颜色
},
{
offset: 1,
color: '#FECE4391' // 100% 处的颜色
}
],
globalCoord: false // 缺省为 false
}
]
var colorLine = ['#33C0CD', '#73ACFF', '#9E87FF', '#FE6969', '#FDB36A', '#FECE43']

option = {
title: {
text: '流浪猫的外来输入',
subtext: 'Fake Data',
left: 'center'
},
tooltip: {
trigger: 'item',
formatter: '{a} <br/>{b} : {c} ({d}%)'
},
legend: {
left: 'center',
top: 'bottom',
data: [
'野生流浪猫迁移',
'弃养的宠物猫',
'商家大量繁殖遗弃的后院猫',
'散养走丢的宠物猫',
'领养后二次遗弃的流浪猫',
'生物实验的猫咪'
]
},
toolbox: {
show: true,
feature: {
mark: { show: true },
dataView: { show: true, readOnly: false },
restore: { show: true },
saveAsImage: { show: true }
}
},
series: [
{
name: 'Area Mode',
type: 'pie',
radius: [20, 140],
center: ['50%', '50%'],
roseType: 'area',

itemStyle: {
borderRadius: 5
},
data: [
{ value: 30, name: '野生流浪猫迁移',itemStyle:{color :colorList[5]}},
{ value: 28, name: '弃养的宠物猫',itemStyle:{color :colorList[4]}},
{ value: 26, name: '商家大量繁殖遗弃的后院猫',itemStyle:{color :colorList[3]}},
{ value: 24, name: '散养走丢的宠物猫',itemStyle:{color :colorList[2]}},
{ value: 22, name: '领养后二次遗弃的流浪猫',itemStyle:{color :colorList[1]}},
{ value: 20, name: '生物实验的猫咪',itemStyle:{color :colorList[0]}}

]
}
]
}