一、matplotlib、pyplot 、pylab关系
1.matplotlib被划分为不同的层次:
matplotlib.pyplot模块:位于matplotlib的顶层,它是一个state-machine environment。该模块中的很多函数是用于给当前Figure的当前Axes添加plot element,比如line、text、image等。它非常类似于Matlab的用法。- 下一层是面向对象的接口:在这一层
pyplot只是用部分函数来创建Figure,然后通过该Figure显式的创建Axes,然后通过面向对象的接口在该Axes上添加图形。极端情况下用户可以完全抛弃pyplot而完全使用面向对象的接口。
对于非交互式绘图,官方文档推荐用pyplot创建Figure,然后使用面向对象接口来绘图。
2.matplotlib的所有plotting function期待输入numpy.array或者numpy.ma.masked_array类型的数据作为输入。某些长得像numpy.array的数据比如numpy.matrix类型的输入数据可能会导致matplotlib工作异常。如果确实需要使用numpy.matrix,你应该首先将它转换为numpy.array
3.matplotlib、pyplot、pylab的关系:
matplotlib:它是整个packagematplotlib.pyplot:是matplotlib的一个module。它为底层的面向对象接口提供了一个state-machine interface。这个state-machine必要的时候隐式创建Figure和Axes,并维护current Figure和current Axespylab是一个便利的module,它导入了matplotlib.pyplot以及numpy,它只是为了plot以及math方便而用。官方文档不推荐使用它。
pyplot.gcf():获取当前的figure对象。pyplot.gca():获取当前的Axes对象
4.代码风格:官方文档不推荐 MATLAB风格的代码。因为MATLAB风格代码维护了全局状态,你执行同一个plot多次可能会发现结果是不同的。官方文档推荐使用如下风格:
import matplotlib.pyplot as plt
import numpy as np
fig=plt.figure()
ax=fig.add_subplot(111)
ax.plot(...)
ax.show()
二、基本概念
1. backend
1.1 matplotlib可以适用于非常广泛的场景:
matplotlib可以交互式地用于python shellmatplotlib可以嵌入到wxpython或者pygtk等GUI程序中matplotlib可以在脚本中使用从而生成postscript image
为了适应于这些场景,matplotlib针对这些target生成不同的输出格式。这种能力称之为backend。
与之相对的frontend指的是用户使用matplotlib而编写的代码。
1.2 有两种类型的backend:
- 交互式的
backend:应用于pygtk、wxpython、tkinter、qt4、macosx等中 - 非交互式的
backend:用于生成image file(如PNG、SVG、PDF、PS等格式文件,这些backend的名字暗示了要存储的文件的格式)
1.3 有多种方法来设置backend,其中后面提到的方法会覆盖前面的方法设置的backend:
- 在
matplotlibrc配置文件中设置的backend参数,如backend: WXAgg #使use wxpython with antigrain(agg) rendering - 设置
MPLBACKEND环境变量,无论是在shell中设置还是在脚本中设置。 - 对单个脚本设置
backend时,可以直接在python命令后添加-d命令(这种方法不推荐,deprecated) - 在脚本中使用特定的
backend时,可以用matplotlib.use('PDF')命令。这条语句必须在import matplotlib.pyplot语句之前执行。如果在import matplotlib.pyplot之后执行use语句,则没有任何效果。通常建议避免使用use()方法,因为使用该脚本的人无法修改backend了。
- 设定
backend时,是忽略大小写的。因此GTKAgg也等价于gtkagg - 查看当前的
backend可以用:matplotlib.get_backend()
1.4 rendering engine:matplotlib提供的常用的rendering engine是Agg,它采用的是Anti-Grain Geometry C++ library。除了macosx之外的所有user interface都可以用agg rendering,如WXAgg,GTKAgg,QT4Agg,TkAgg这些backend。
某些user interface还支持其他引擎,如GTK支持Cario引擎,如GTKCariro backend。
下面是所有的Rendering engine:
AGG:输出png格式文件。它可以输出高质量的图形PS:输出pseps格式文件。它是Postscript outputPDF:输出pdf格式文件。SVG:输出svg格式文件Cairo:可以输出png、ps、pdf、svg...等格式文件GDK:可以输出png、jpg、tiff...等格式文件,它使用Gimp Drawing Kit
要想保存成指定类型文件,如PDF,那么首先要设置合适的backend。
2. 交互式模式
2.1 使用交互式backend可以plotting to the screen,但是前提是matplotlib必须是interactive mode。
你可以在matplotlibrc配置文件中设置matplotlib是否位于交互模式,也可以通过代码matplotlib.interacite()来设置matplotlib位于交互模式。你可以通过代码matplotlib.is_interactive()来判断代码是否交互模式。通常并不建议在绘图过程中修改交互模式,因此要提前修改交互模式再绘图。
交互模式也可以通过matplotlib.pyplot.ion()开启交互模式,由matplotlib.pyplot.ioff()关闭交互模式。另外交互模式支持ipython和python shell,但是不支持IDLE IDE。

2.2 在交互模式下:
pyplot.plot()绘图之后图表马上显示,pyplot自动绘制到屏幕,不需要调用pyplot.show()- 图表显式之后你可以继续输入命令。任何对图形的修改会实时的反应到图表中去。
- 使用面向对象的方法,如
Axes的方法并不会自动调用draw_if_interactive()。如果你通过Axes来修改图表,想更新图表的话那么你需要手动调用.draw()方法。而pyplot模块中的函数会主动调用draw_if_interactive(),因此如果你是通过pyplot模块修改图表那么不需要手动调用.draw()方法就是实时绘制。
2.3 在非交互模式下:
- 在绘图之后必须手动调用
pyplot.show()才能显示图表。该函数会阻塞执行直到你关闭了图表窗口。 - 所有的绘制工作会延迟到
pyplot.show()函数调用 - 在1.0版本以前,单个脚本文件中只能调用一次
pyplot.show(),在1.01版本之后该限制被放松。
3. matplotlib的颜色
3.1 可以通过matplotlib.pyplot.colors()方法获取matplotlib支持的所有颜色。该方法不做任何事情,就是提供一个帮助文档。
3.2 matplotlib提供了下面颜色的别名:'b':蓝色;'g':绿色;'r':红色;'y':黄色;'c':青色;'k':黑色;'m':洋红色;'w':白色。
3.3 你也可以定制自己的颜色。有两种方法:
- 使用HTML十六进制字符串:如
'#eeefff' - 使用HTML颜色名字:如
'red' - 使用一个归一化到闭区间[0-1]的RGB元组:如
color=(0.3,0.3,0.4)
4. matplotlib.cm
matplotlib.cm模块包含了一系列的colormap,以及相关的函数。它主要有两个函数:
4.1 matplotlib.cm.get_cmap(name=None, lut=None):获取一个colormap实例。其中:
name:指定了colormap的名字。如果为None,则使用rc配置。如果它已经是colormap实例,则直接返回该实例。注意:register_cmap注册的colormap优先查询lut:一个整数。如果非None,则指定了查询表的number of entries
4.2 matplotlib.cm.register_cmap(name=None, cmap=None, data=None, lut=None):注册一个colormap。有两种使用方式:
register_cmap(name='swirly', cmap=swirly_cmap):此时cmap参数必须是matplotlib.colors.Colormap实例。name默认为该Colormap实例的.name属性。register_cmap(name='choppy', data=choppydata, lut=128):此时这三个参数传递给matplotlib.colors.LinearSegementedColormap初始化函数。
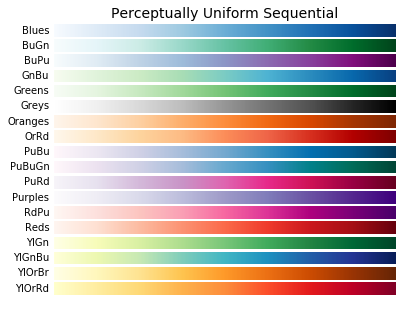
所有的内置的name如下:
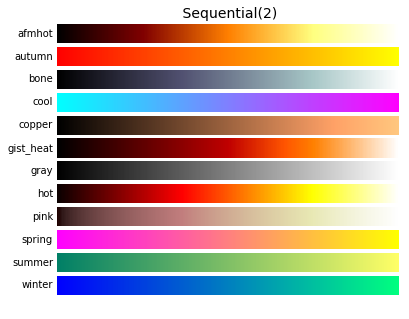
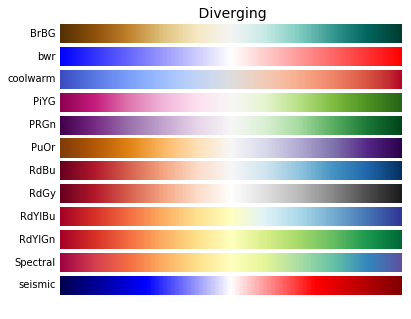
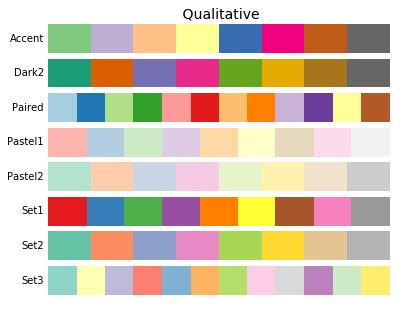
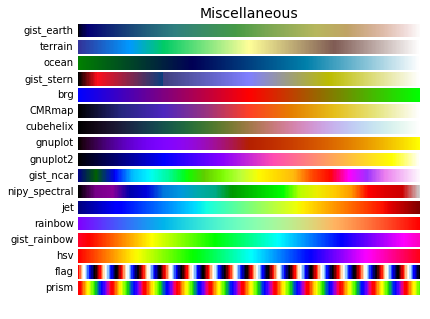
'Perceptually Uniform Sequential':['viridis', 'inferno', 'plasma', 'magma']
  'Sequential':['Blues', 'BuGn', 'BuPu','GnBu', 'Greens', 'Greys', 'Oranges', 'OrRd',
  'PuBu', 'PuBuGn', 'PuRd', 'Purples', 'RdPu','Reds', 'YlGn', 'YlGnBu',
  'YlOrBr', 'YlOrRd']
  'Sequential (2)':['afmhot', 'autumn', 'bone', 'cool','copper', 'gist_heat', 'gray',
  'hot','pink', 'spring', 'summer', 'winter']
  'Diverging':['BrBG', 'bwr', 'coolwarm', 'PiYG', 'PRGn', 'PuOr',
  'RdBu', 'RdGy', 'RdYlBu', 'RdYlGn', 'Spectral','seismic']
  'Qualitative':['Accent', 'Dark2', 'Paired', 'Pastel1', 'Pastel2',
  'Set1', 'Set2', 'Set3']
  'Miscellaneous':['gist_earth', 'terrain', 'ocean', 'gist_stern','brg',
  'CMRmap', 'cubehelix','gnuplot', 'gnuplot2',
  'gist_ncar','nipy_spectral', 'jet', 'rainbow',
  'gist_rainbow', 'hsv', 'flag', 'prism']
你可以使用cm.get_cmap('winter')来使用,也可以直接用cm.winter来使用。
举例:
import numpy as np
import matplotlib.pyplot as plt

gradient = np.linspace(0,1,256)
gradient = np.vstack((gradient,gradient))
gradient[:10,:10]

def plot_color_gradients(cmap_name,cmap_list):
    fig,axes = plt.subplots(nrows=len(cmap_list))
    fig.subplots_adjust(top=0.95,bottom=0.01,left=0.2,right=0.99)
    axes[0].set_title(cmap_name,fontsize=14)

    for ax,name in zip(axes,cmap_list):
        ax.imshow(gradient,aspect='auto',cmap=plt.get_cmap(name)) # 对灰度图染色
        pos = list(ax.get_position().bounds)
        x_test = pos[0]-0.01
        y_test = pos[1] + pos[3]/2.
        fig.text(x_test,y_test,name,va="center",ha="right",fontsize=10)
        ax.set_axis_off() # 关闭ticks

%matplotlib inline
name= "Perceptually Uniform Sequential"
color_list = ["viridis","inferno","plasma","magma"]
plot_color_gradients(name,color_list)

%matplotlib inline
name= "Perceptually Uniform Sequential"
color_list = ['Blues', 'BuGn', 'BuPu','GnBu', 'Greens', 'Greys', 'Oranges', 'OrRd',
  'PuBu', 'PuBuGn', 'PuRd', 'Purples', 'RdPu','Reds', 'YlGn', 'YlGnBu',
  'YlOrBr', 'YlOrRd']
plot_color_gradients(name,color_list)
%matplotlib inline
name= " Sequential(2)"
color_list = ['afmhot', 'autumn', 'bone', 'cool','copper', 'gist_heat', 'gray',
  'hot','pink', 'spring', 'summer', 'winter']
plot_color_gradients(name,color_list)
%matplotlib inline
name= " Diverging"
color_list = ['BrBG', 'bwr', 'coolwarm', 'PiYG', 'PRGn', 'PuOr',
  'RdBu', 'RdGy', 'RdYlBu', 'RdYlGn', 'Spectral','seismic']
plot_color_gradients(name,color_list)
%matplotlib inline
name= " Qualitative"
color_list = ['Accent', 'Dark2', 'Paired', 'Pastel1', 'Pastel2',
  'Set1', 'Set2', 'Set3']
plot_color_gradients(name,color_list)
%matplotlib inline
name= "Miscellaneous"
color_list = ['gist_earth', 'terrain', 'ocean', 'gist_stern','brg',
  'CMRmap', 'cubehelix','gnuplot', 'gnuplot2',
  'gist_ncar','nipy_spectral', 'jet', 'rainbow',
  'gist_rainbow', 'hsv', 'flag', 'prism']
plot_color_gradients(name,color_list)
5. matplotlib.colors
5.1 matplotlib.colors是一个模块,用于转换数字或者颜色参数到 RGB 或者RGBA
RGB:一个浮点数元组,有3个浮点数。每个数都是 0-1之间RGBA:一个浮点数元组,有4个浮点数。每个数都是 0-1之间
5.2 colors.cnames是个字典,它给出了常用颜色的字符串和对应的#FFFFFF形式。
import numpy as np
import matplotlib.pyplot as plt
import matplotlib.colors as cols

list(cols.cnames.items())[:5]
[('aliceblue', '#F0F8FF'),
 ('antiquewhite', '#FAEBD7'),
 ('aqua', '#00FFFF'),
 ('aquamarine', '#7FFFD4'),
 ('azure', '#F0FFFF')]
5.3 colors.rgb2hex(rgb)函数:给出了rgb元组到#FFFFFF形式。 而hex2color(s)给出了#FFFFFF到rgb形式。
cols.rgb2hex((0,0.5,1)) # '#0080ff'

cols.hex2color((0,0.5,1)) # (0.0, 0.5, 1.0)
5.4 colors.ColorConverter类是个颜色转换器类。它提供了下面方法用于转换颜色:
-
.to_rgb(arg):转换其他类型的颜色到标准的rgb三元组。其中arg可以为一个rgb/rgba序列,或者一个字符串,字符串格式为:- 一个代表颜色的字符,如
'rgbcmykw' - 一个十六进制的颜色字符串,如
'#0FFFFFF' - 一个标准的颜色的名字,如
'red' - 一个代表浮点数的字符串,如
'0.5'
- 一个代表颜色的字符,如
-
.to_rgba(arg, alpha=None):转换其他类型的颜色到标准的rgba四元组 -
to_rgba_array(c, alpha=None):它返回一个ndarray,而不是一个元组
colors.colorConverter是模块提供的一个默认的实例。
cols.colorConverter.to_rgb("r") # (1.0, 0.0, 0.0)

cols.colorConverter.to_rgb("0.5") # (0.5, 0.5, 0.5)

cols.colorConverter.to_rgb([0.5,0.5,0.3]) # (0.5, 0.5, 0.3)

cols.colorConverter.to_rgba_array('0.3') # array([[0.3, 0.3, 0.3, 1. ]])
5.5 colors.Colormap是所有colormap的基类。colormap用于将[0,1]之间的浮点数转换为RGBA颜色。
它是一个颜色条,浮点数对应了颜色条的位置(归一化为0.0~1.0),
RGBA颜色对应了指定颜色条某个位置处的颜色。
其属性有:
name:colormap名字N:一个整数,表示rgb颜色层级,默认为256级
常用方法有:
-
__call__(self, X, alpha=None, bytes=False):颜色转换。X为一个标量或者ndarray,给出了待转换的数据。如果是浮点数,则必须是[0.0,1.0]之间。如果是整数,则必须是[0,self.N)之间。如果是标量,则返回rgba四元组。如果是ndarray,则返回一个ndarray,相当于对每个元素进行标量转换,然后组装成ndarrayalpha:一个浮点数,给出了透明度。必须是0到1之间bytes:一个布尔值。如果为True,则返回的结果是[0,255]之间。否则是[0.0,1.0]之间
5.6 colors.LinearSegmentColormap(Colormap):是Colormap的子类。
- 额外的属性:
._gamma/._segmentdata -
它的构造函数为:
__init__(self, name, segmentdata, N=256, gamma=1.0)。其中segmentdata是一个字典,字典的键分别为'red'/'green'/'blue',字典的值为一个列表,列表元素为三元组(alpha被忽略)。如:
 {'red':[(0.0,  0.0, 0.0),
  (0.5,  1.0, 1.0),
  (1.0,  1.0, 1.0)],
  'green': [(0.0,  0.0, 0.0),
  (0.25, 0.0, 0.0),
  (0.75, 1.0, 1.0),
  (1.0,  1.0, 1.0)],
  'blue':  [(0.0,  0.0, 0.0),
  (0.5,  0.0, 0.0),
  (1.0,  1.0, 1.0)]}
- 每一行代表了元组
(x,y0,y1)。其中red/green/blue中,每一列x必须从0递增到1;y0/y1也是如此。对于任何落到x[i]~x[i+1]之间的值z,其映射的颜色由y1[i]和y0[i+1]插值决定。 - 类方法
from_list(name, colors, N=256, gamma=1.0):从一个颜色序列中构造LinearSegmentColormap。其中colors是一个颜色序列,matplotlib会将颜色均匀分布,val=0处对应colors[0],val=1处对应colors[-1]。你也可以传递一个(value,color)元组的序列,其中value指定了对应位置处的color,其中value位于[0.0,1.0]
举例:
gradient = np.linspace(0,1,256)
gradient = np.vstack((gradient,gradient)) # 生成一个256阶灰度图
print(gradient[:10,:10])
def plot_color_gradients(colormap):
fig = plt.figure()
ax = fig.add_subplot(1,1,1)
ax.set_title(colormap.name,fontsize=14)
ax.imshow(gradient,aspect='auto',cmap = colormap) # 对灰度图染色
ax.set_axis_off() # 关闭ticks
from matplotlib import cm
color_buildin = cm.get_cmap('winter') # 内建的colormap
color_buildin.name,color_buildin.N # Colormap的属性,('winter', 256)
color_buildin(0.5),color_buildin(np.linspace(0,0.5,5)) # 在颜色条上取点
((0.0, 0.5019607843137255, 0.7490196078431373, 1.0),
array([[0. , 0. , 1. , 1. ],
[0. , 0.1254902 , 0.9372549 , 1. ],
[0. , 0.25098039, 0.8745098 , 1. ],
[0. , 0.37647059, 0.81176471, 1. ],
[0. , 0.50196078, 0.74901961, 1. ]]))
color_buildin._gamma,color_buildin._segmentdata
(1.0,
{'red': ((0.0, 0.0, 0.0), (1.0, 0.0, 0.0)),
'green': ((0.0, 0.0, 0.0), (1.0, 1.0, 1.0)),
'blue': ((0.0, 1.0, 1.0), (1.0, 0.5, 0.5))})
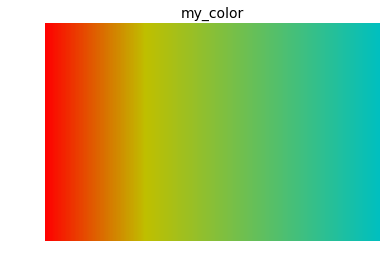
my_color = cols.LinearSegmentedColormap.from_list('my_color',colors=[(0.0,'r'),(0.3,'y'),(1.0,'c')])
my_color._segmentdata
{'red': [(0.0, 1.0, 1.0), (0.3, 0.75, 0.75), (1.0, 0.0, 0.0)],
'green': [(0.0, 0.0, 0.0), (0.3, 0.75, 0.75), (1.0, 0.75, 0.75)],
'blue': [(0.0, 0.0, 0.0), (0.3, 0.0, 0.0), (1.0, 0.75, 0.75)],
'alpha': [(0.0, 1, 1), (0.3, 1, 1), (1.0, 1, 1)]}
%matplotlib inline
plot_color_gradients(color_buildin) # 内建的颜色

%matplotlib inline
plot_color_gradients(my_color) # 自定义的颜色
5.7 colors.ListedColormap(Colormap)是Colormap的子类。它用于从一个list of colors中创建colormap。
- 构造方法为:
__init__(self, colors, name=’from_list’, N=None)。其中color是一个颜色列表。或者为一个浮点数ndarray,其形状为Nx3或者Nx4。N为colormap的条目数,如果N <len(colors),则截断colors。如果N > len(colors),则重复colors到指定长度。
举例:
list_color = cols.ListedColormap(colors=['r','g','y','k','c'])
list_color # <matplotlib.colors.ListedColormap at 0x17c02bd6940>

%matplotlib inline
plot_color_gradients(list_color) # 自定义的颜色
5.8 colors.Normalize:是归一化类。它用于将数据归一化到[0.0,1.0]
- 构造方法为:
__init__(self, vmin=None, vmax=None, clip=False)。如果未提供vmin/vmax,则使用数据的最小值和最大值。如果clip=True,则落在vmin~vmax之外的数据被截断为0或者1。如果vmin==vmax,则始终返回 0 - 属性有:
.vmin/.vmax/.clip - 类方法为:
process_value(value):调整value的格式,从而方便后续的操作 - 实例方法:
__call__(self, value, clip=None):归一化处理 - 实例方法:
inverse(self, value):逆归一化处理
举例:
gradient = np.linspace(10,100,256)
gradient[:10]
# array([10.        , 10.35294118, 10.70588235, 11.05882353, 11.41176471,
       11.76470588, 12.11764706, 12.47058824, 12.82352941, 13.17647059])

norm = cols.Normalize()
gradient2 = norm(gradient)
(gradient2<=1.0).all()
# True

np.isclose(gradient,norm.inverse(gradient2)).all()
# True
5.9 colors.LogNorm类是Normalize的子类,它使用对数来归一化
5.10 colors.rgb_to_hsv(arr):将rgb形式的浮点数数组转换为hsv格式的浮点数组。而hsv_to_rgb(hsv)执行的是逆向操作。
6. matplotlib.colorbar
6.1 matplotlib.colorbar模块包含了创建colorbar的一些方法和类。
ColorbarBase:绘制colorbar的基类Colorbar:用于imges/contour等的colorbar类make_axes():用于调整Axes并向其中添加一个colorbar
6.2 matplotlib.colorbar.Colorbar(ax, mappable, **kw):Colorbar类。通常没必要显式调用构造函数,而应该调用下面两个方式:
Figure.colorbar(mappable, cax=None, ax=None, use_gridspec=True, **kw)pyplot.colorbar(mappable=None, cax=None, ax=None, **kw)
参数:
mappable:为Image/ContourSet对象。它是你将要应用colorbar的对象cax:它指定了你将在哪个Axes内绘制colorbarax:你的新的colorbar Axes从该ax中拿到绘制空间。use_gridspec:一个布尔值。如果cax=None,则如果use_gridspec=True,则创建一个Subplot对象。如果为False,则创建一个Axes对象。
额外的参数参与设置两个对象:
-
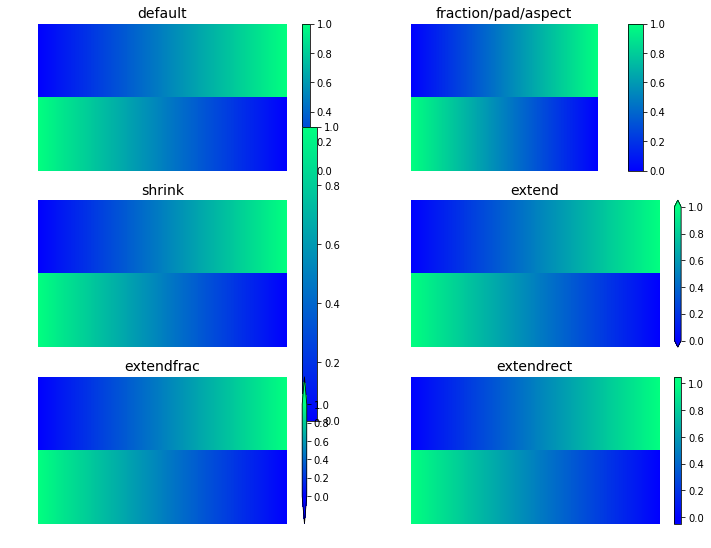
axes对象:orientation:设置为垂直'vertical'还是水平'horizontal'fraction:一个浮点数,指定从原始的Axes中窃取多少倍的空间来绘制colorbar。默认为 0.15pad:0.05 if vertical, 0.15 if horizontal; 一个浮点数,指定两个Axes的间距shrink: 指定colorbar的伸缩比。默认为 1.0aspect:指定colorbar的长宽比。默认为 20
-
colorbar对象:extend:一个字符串。可以为'neither'/'both'/'min'/'max'。如果不是'neither',则它会在colorbar对应端添加箭头(如果extendrect=False)extendfrac:colorbar指示超出部分的箭头的长度。extendrect:一个布尔值。如果为True,则超出部分不用箭头。drawedges:一个布尔值,如果为True,则绘制colorbar的边。ticks:给出你要显示哪些tickformat:指定格式化方式。可以为格式化字符串如%.3f,或者Formatter对象。
举例:
%matplotlib inline
fig = plt.figure(figsize=(12,10))
ax = fig.add_subplot(4,2,1)
plt.colorbar(plot_img(ax,'default'),ax=ax)#default

ax = fig.add_subplot(4,2,2)
plt.colorbar(plot_img(ax,'fraction/pad/aspect'),ax=ax,fraction=0.3,pad=0.1,aspect=10) # set axes

ax = fig.add_subplot(4,2,3)
plt.colorbar(plot_img(ax,'shrink'),ax=ax,shrink=2) # shrink

ax = fig.add_subplot(4,2,4)
plt.colorbar(plot_img(ax,'extend'),ax=ax,extend='both') # extend

ax = fig.add_subplot(4,2,5)
plt.colorbar(plot_img(ax,'extendfrac'),ax=ax,extend='both',extendfrac=0.3) # extendfrac

ax = fig.add_subplot(4,2,6)
plt.colorbar(plot_img(ax,'extendrect'),ax=ax,extend='both',extendrect=True) # extendrect

fig.subplots_adjust(top=0.95,bottom=0.01,left=0.2,right=0.99,wspace=0.2)
参考文献:
【1】https://matplotlib.org/tutorials/colors/colormaps.html#sphx-glr-tutorials-colors-colormaps-py