本文介绍的是数据可视化中的一种常见方式:文字云。
用Python构建文字云主要分为两步:
1)构建文字云
1 from wordcloud import WordCloud
2
3 wc = WordCloud(background_color="white", max_words=display,    ### white:为文字云的背景颜色; display:为文字云最多显示的词数目
4                stopwords=more_stopwords,font_path="BROADW.TTF").generate(words1)  ### more_stopwords: 为要过滤掉的,不在文字云中显示的词;
5                font_path: 字体; word1 :为要构建文字云的目标词
上面这段代码就构建了一个文字云对象wc,接下来的任务就是要把这个对象可视化出来。
2)展示文字云
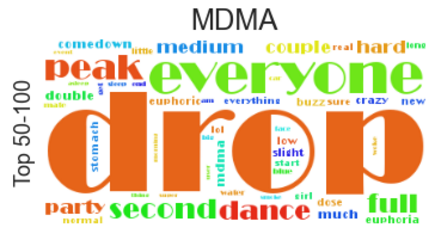
 1 cloudtitle=['MDMA','Amphethamines','Unknown']         ###水平方向的title
 2 cloudy=['Top 50-100','Top 100-150','Top 200-250']     ###竖直方向的title
 3
 4 fig, axs = plt.subplots(3,3, figsize=(18, 9), facecolor='w', edgecolor='k')
 5 #axs.set_xlabel('common xlabel')
 6 fig.text(0.5, 0.1, 'Columns Split by SC Cateogry label', ha='center', va='center',fontsize=24)
 7 fig.subplots_adjust(hspace = .05, wspace=.00001)
 8
 9 axs = axs.ravel()  ### 把图框进行平铺,这里说明画框内有多个图,用下标访问每一个图
10
11 axs[0].imshow(wc)
12
13 axs[0].set_title(cloudtitle[0],fontsize=24,fontweight=6)
14 axs[0].set_ylabel(cloudy[0],fontsize=18,fontweight=3)
15
16 axs[0].set_yticks([]) #-set tick marks to empty list.
17 axs[0].set_xticks([])
18
19
20
效果如下图所示: