本篇随笔为转载,原贴地址:
2 main differences between classification and regression trees
Those beginning to explore predictive analytics tools are confused by the myriad techniques that are available, apparently to address the same type of problem. Decision trees are probably one of the most common and easily understood tools. However even here there are several types of "trees" that beginners must get a grip on. Of these, two types are probably the most significant.
The first type is the one described by the many articles in this blog: Classification tree. This is also referred to as a Decision tree by default. However there is another basic decision tree in common use: Regression tree, which also works in a very similar fashion. This article explores the main differences between them: when to use each, how they differ and some cautions.
Difference 1: When to use classification vs regression tree
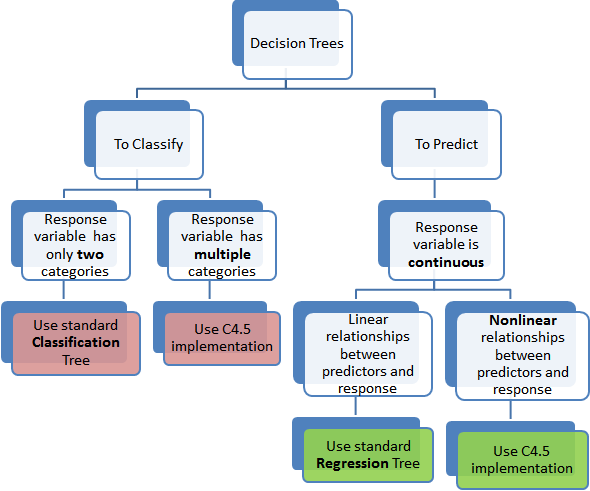
This might seem like a trivial issue - once you know the difference! Classification trees, as the name implies are used to separate the dataset into classes belonging to the response variable. Usually the response variable has two classes: Yes or No (1 or 0). If the target variable has more than 2 categories, then a variant of the algorithm, called C4.5, is used. For binary splits however, the standard CART procedure is used. Thus classification trees are used when the response or target variable is categorical in nature.
Regression trees are needed when the response variable is numeric or continuous. For example, the predicted price of a consumer good. Thus regression trees are applicable for prediction type of problems as opposed to classification.
Keep in mind that in either case, the predictors or independent variables may be categorical or numeric. It is the target variable that determines the type of decision tree needed.
Difference 2: How they work
In a standard classification tree, the idea is to split the dataset based on homogeneity of data. Lets say for example we have two variables: age and weight that predict if a person is going to sign up for a gym membership or not. In our training data if it showed that 90% of the people who are older than 40 signed up, we split the data here and age becomes a top node in the tree. We can almost say that this split has made the data "90% pure". Rigorous measures of impurity, based on computing proportion of the data that belong to a class, such as entropy or Gini index are used to quantify the homogeneity in Classification trees.
In a regression tree the idea is this: since the target variable does not have classes, we fit a regression model to the target variable using each of the independent variables. Then for each independent variable, the data is split at several split points. At each split point, the "error" between the predicted value and the actual values is squared to get a "Sum of Squared Errors (SSE)". The split point errors across the variables are compared and the variable/point yielding the lowest SSE is chosen as the root node/split point. This process is recursively continued.
We discussed a C4.5 classification tree (for more than 2 categories of target variable) here which uses information gain to decide on which variable to split. In a corresponding regression tree, standard deviation is used to make that decision in place of information gain. More technical details are here. Regression trees, by virtue of using regression models lose the one strength of standard decision trees: ability to handle highly non-linear parameters. In such cases, it may be better to use the C4.5 type implementation.
This tree below summarizes at a high level the types of decision trees available!