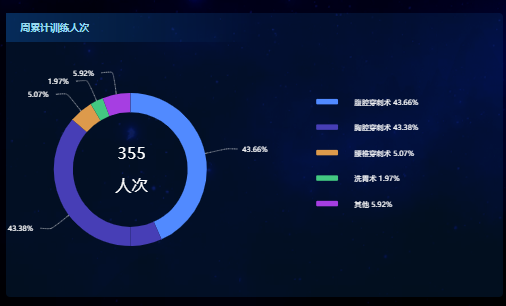
数据过多,且几个比较小的数据在一块扎堆
例如:
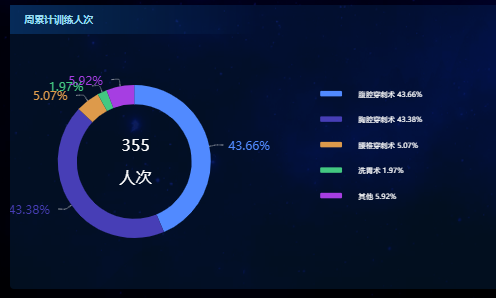
*解决方法: *
series: [
						{
							name: '',
							type: 'pie',
							center: ["25%", "50%"],
							radius: ['45%', '60%'],
							minAngle: 10,  // 设置每块扇形的最小占比
							avoidLabelOverlap: false,
							hoverAnimation: false,
							silent: true,
							label: {
								normal: {
									show: true,
									formatter: "{d}% ",
									textStyle: {
										fontSize: this.standSize / 150,
										color: "#fff"
									},
								},
							},
							labelLine: {
								normal: {
									lineStyle: {
										color: 'rgba(255, 255, 255, 0.3)'
									},
									smooth: 0.2,
									length: this.standSize / 50,
									length2: this.standSize / 100,
								}
							},
							data: data
						}
					],
本段代码是在vue实例中写的,standSize在data中已定义standSize: document.body.clientWidth
*修改后如下: *