两台服务器:
S1:172.16.252.128
S2:172.16.252.128
相关组件下载地址:
https://prometheus.io/download/
一、下载安装prometheus软件
在S1服务器操作,
1、下载安装prometheus
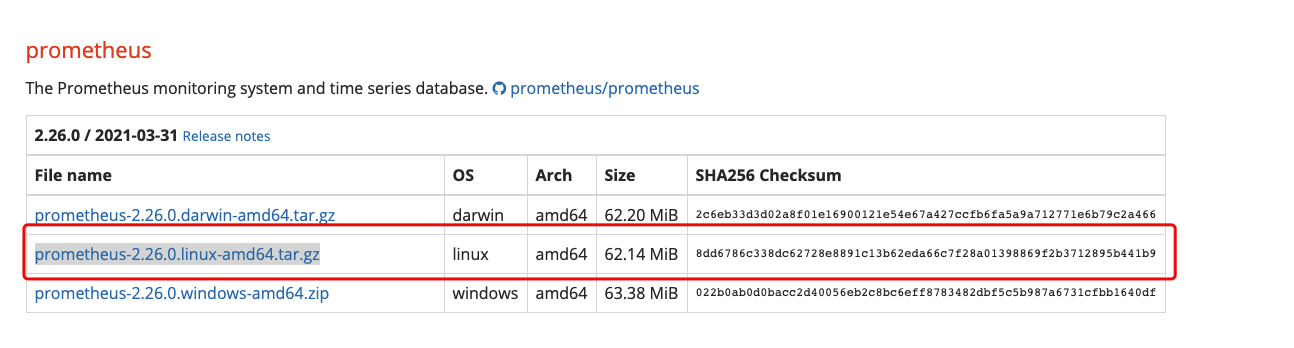
wget https://github.com/prometheus/prometheus/releases/download/v2.26.0/prometheus-2.26.0.linux-amd64.tar.gz
tar xvf prometheus-2.26.0.linux-amd64.tar.gz -C /usr/local
cd /usr/local
mv prometheus-2.26.0.linux-amd64/ prometheus
cd prometheus/
./prometheus --config.file="/usr/local/prometheus/prometheus.yml"
说明:【/usr/local/prometheus/prometheus.yml"】是prometheus配置文件,后面会修改这个配置文件。
[root@localhost prometheus]# ps -ef|grep prometheus
root      45293  44695  0 03:57 pts/2    00:00:00 ./prometheus --config.file=/usr/local/prometheus/prometheus.yml
查看进程已经存在
默认端口号是9090
[root@localhost prometheus]# netstat -antp|grep 9090
tcp6       0      0 :::9090                 :::*                    LISTEN      45293/./prometheus
tcp6       0      0 ::1:9090                ::1:35918               ESTABLISHED 45293/./prometheus
tcp6       0      0 ::1:35918               ::1:9090                ESTABLISHED 45293/./prometheus
2、通过浏览器访问http://服务器IP:9090就可以访问到prometheus的主界面
访问 http://172.16.252.128:9090
可以正常访问主界面,
点击界面Status--->Targes ,可以看到endpoint为【http://localhost:9090/metrics】 的机器。
二、安装node_exporter插件
在S2服务器操作
https://prometheus.io/download/#node_exporter
下载node_exporters组件
[root@bogon ~]# wget https://github.com/prometheus/node_exporter/releases/download/v1.1.2/node_exporter-1.1.2.linux-amd64.tar.gz
[root@bogon ~]# tar xvf node_exporter-1.1.2.linux-amd64.tar.gz -C /usr/local/
[root@bogon ~]# cd /usr/local/
[root@bogon local]# mv node_exporter-1.1.2.linux-amd64/ node_exporter
[root@bogon local]# cd node_exporter/
[root@bogon node_exporter]# nohup /usr/local/node_exporter/node_exporter &
[root@bogon node_exporter]# tai l-f nohup.out  ---查看日志
查看进程
[root@bogon node_exporter]# ps -ef|grep node_exporter
root      42360   2710  0 03:33 pts/0    00:00:01 /usr/local/node_exporter/node_exporter
node_exporter占用的是9100端口号
[root@bogon node_exporter]# netstat -antp|grep 9100
tcp6       0      0 :::9100                 :::*                    LISTEN      42360/node_exporter
tcp6       0      0 172.16.252.129:9100     172.16.252.128:42778    ESTABLISHED 42360/node_exporter
通过浏览器访问http://被监控端IP:9100/metrics就可以查看到 node_exporter在被监控端收集的监控信息
访问【http://172.16.252.129:9100/metrics】
但在S1服务器【http://172.16.252.128:9090/】--->Status--->Targes 看不到这个机器,需要修改S1服务器prometheus配置文件,重启生效。
在S1服务器操作如下
vim /usr/local/prometheus/prometheus.yml

  - job_name: 'node1'
    static_configs:
    - targets: ['172.16.252.129:9100']

重启prometheus
pkill prometheus
./prometheus --config.file="/usr/local/prometheus/prometheus.yml"
再访问【http://172.16.252.128:9090/】--->Status--->Targes,可以看到多一个node1机器。
三、安装mysqld_exporter,监控MySQL
说明 :我的mysql装在S2服务器上了
下载地址:https://prometheus.io/download/#mysqld_exporter
在S2服务器操作,
[root@bogon ~]# wget https://github.com/prometheus/mysqld_exporter/releases/download/v0.12.1/mysqld_exporter-0.12.1.linux-amd64.tar.gz
[root@bogon ~]# tar xvf mysqld_exporter-0.12.1.linux-amd64.tar.gz  -C /usr/local/
[root@bogon ~]# cd /usr/local/
[root@bogon local]# mv mysqld_exporter-0.12.1.linux-amd64/ mysqld_exporter
[root@bogon local]# cd mysqld_exporter/
[root@bogon mysqld_exporter]# ll
total 14484
-rw-r--r--. 1 3434 3434    11325 Jul 29  2019 LICENSE
-rwxr-xr-x. 1 3434 3434 14813452 Jul 29  2019 mysqld_exporter
-rw-r--r--. 1 3434 3434       65 Jul 29  2019 NOTICE

#提示:没有配置文件,需要自己编辑一个,需要先往数据库中创建用户:mysql_monitor  密码:123456 ,详细步骤不写了
grant select,replication client,process ON *.* to 'mysql_monitor'@'%' identified by '123456';

[root@bogon mysqld_exporter]# vim /usr/local/mysqld_exporter/.my.cnf

[client]
user=mysql_monitor
password=123456
启动监控插件
nohup /usr/local/mysqld_exporter/mysqld_exporter --config.my-cnf=/usr/local/mysqld_exporter/.my.cnf &
查看进程
[root@bogon mysqld_exporter]# ps -ef|grep mysqld_exporter
root      43184  43026  0 04:31 pts/1    00:00:00 /usr/local/mysqld_exporter/mysqld_exporter --config.my-cnf=/usr/local/mysqld_exporter/.my.cnf
占用的端口号是9104
[root@bogon mysqld_exporter]# netstat -antp|grep 9104
tcp6       0      0 :::9104                 :::*                    LISTEN      43184/mysqld_export
通过这个连接可以看到采集到的数值【http://172.16.252.129:9104/metrics】
修改S1服务器prometheus配置,
vim /usr/local/prometheus/prometheus.yml
  - job_name: 's2_mysql'
    static_configs:
    - targets: ['172.16.252.129:9104']
重启prometheus服务
pkill prometheus
./prometheus --config.file="/usr/local/prometheus/prometheus.yml"
http://172.16.252.128:9090/targets
打开web界面,看到已经有s2_mysql这个数据库监控了

分享配置文件:
/home/xxx/prometheus/prometheus --config.file=/home/xxx/prometheus/prometheus.yml --storage.tsdb.path=/data/prometheus_data --storage.tsdb.retention.time=60d --storage.tsdb.wal-compression --web.enable-admin-api --log.level=info --web.enable-lifecycle --web.listen-address=0.0.0.0:32766
cat /home/xxx/prometheus/prometheus.yml

global:

  scrape_interval: 1m

  scrape_timeout: 10s

  evaluation_interval: 15s

scrape_configs:

- job_name: prometheus

  honor_timestamps: true

  scrape_interval: 15s

  scrape_timeout: 10s

  metrics_path: /metrics

  scheme: http

  static_configs:

  - targets:

    - localhost:32766

- job_name: MySQL

  honor_timestamps: true

  scrape_interval: 1m

  scrape_timeout: 10s

  metrics_path: /metrics

  scheme: http

  relabel_configs:

  - source_labels: [__address__]

    separator: ;

    regex: (.*)

    target_label: __address__

    replacement: $1

    action: replace

  file_sd_configs:

  - files:

    - /home/xxx/prometheus/monitor_mysql.yml

    refresh_interval: 1m

- job_name: MongoDB

  honor_timestamps: true

  scrape_interval: 1m

  scrape_timeout: 10s

  metrics_path: /metrics

  scheme: http

  static_configs:

  - targets:

    - 1.1.1.1:9114

    labels:

      service_name: single-1.1.1.1

      region: ID

  - targets:

    - 2.2.2.2:9115

    labels:

      service_name: rs-3.3.3.3/8/11

      region: ID


- job_name: Redis

  honor_timestamps: true

  scrape_interval: 1m

  scrape_timeout: 10s

  metrics_path: /metrics

  scheme: http

  static_configs:

  - targets:

    - 4.4.4.4:9116

    labels:

      service_name: single-4.4.4.4

      region: ID

  - targets:

    - 5.5.5.5:9119

    labels:

      service_name: single-5.5.5.5:6389

      region: ID
cat /home/xxx/prometheus/monitor_mysql.yml

  - targets:

    - 1.1.1.1:9105

    labels:

      service_name: master-1.1.1.1

      region: ID

  - targets:

    - 2.2.2.2:9106

    labels:

      service_name: slave-3.3.3.3

      region: ID