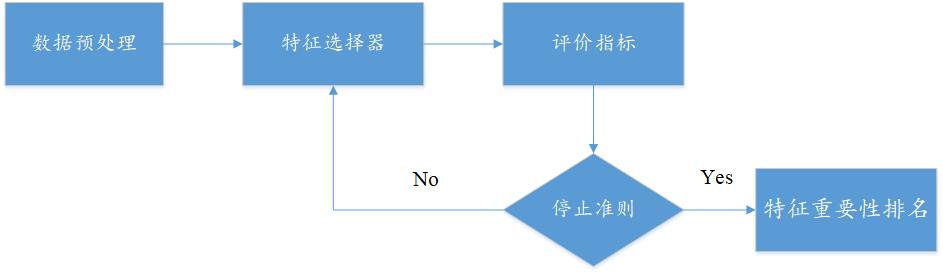
1. 特征选择的思维导图
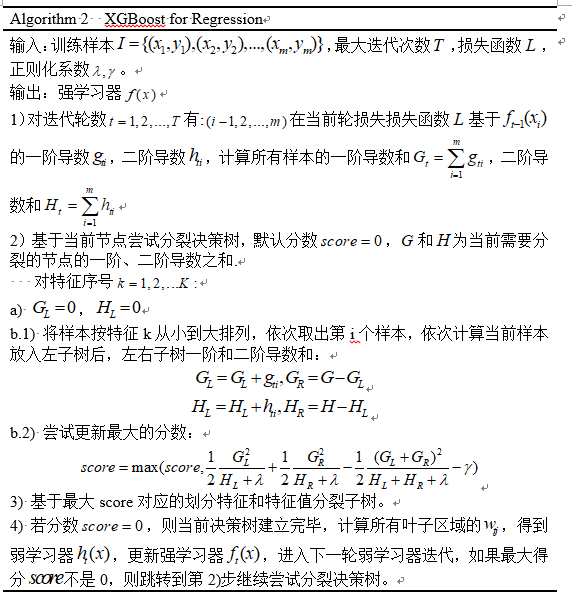
2. XGBoost特征选择算法
(1) XGBoost算法背景
2016年,陈天奇在论文《 XGBoost:A Scalable Tree Boosting System》中正式提出该算法。XGBoost的基本思想和GBDT相同,但是做了一些优化,比如二阶导数使损失函数更精准;正则项避免树过拟合;Block存储可以并行计算等。XGBoost具有高效、灵活和轻便的特点,在数据挖掘、推荐系统等领域得到广泛的应用。
(2) 算法原理
(3) 算法实现--python
from sklearn.model_selection import train_test_split
from sklearn import metrics
import xgboost as xgb
import matplotlib.pyplot as plt
from sklearn.model_selection import GridSearchCV
import pandas as pd, numpy as np
import matplotlib as mpl

# mpl.rcParams['font.sans-serif']=['FangSong']
# mpl.rcParams['axes.unicode_minus']=False

fpath = r".processDatafilter.csv"
Dataset = pd.read_csv(fpath)

x = Dataset.loc[:, "nAcid":"Zagreb"]
y1 = Dataset.loc[:, "IC50_nM"]
y2 = Dataset.loc[:, "pIC50"]

names = x.columns
names = list(names)
key = list(range(0, len(names)))
names_dict = dict(zip(key, names))
names_dicts = pd.DataFrame([names_dict])

x_train, x_test, y_train, y_test = train_test_split(x, y2, test_size=0.33, random_state=7)
"""
max_depth:树的最大深度
"""
model = xgb.XGBRegressor(max_depth=6, learning_rate=0.12, n_estimators=90, min_child_weight=6, objective="reg:gamma")
model.fit(x_train, y_train)

feature_important = model.feature_importances_
rank_idx  = np.argsort(feature_important)[::-1]
rank_idx30 = rank_idx[:30]

rank_names30 = names_dicts.loc[:, rank_idx30]
label = rank_names30.values[0, :]
path1 = r"Xgboost排名前30的特征.csv"
pd.DataFrame(label).to_csv(path1, index=False)

x_score = np.sort(feature_important)[::-1]
path = r"Xgboost排名前30的得分.csv"
pd.DataFrame(x_score[:30]).to_csv(path, index=False)
# xgboost网格搜索调参
gsCv = GridSearchCV(model,
                {'max_depth':list(range(3, 10, 1)),
                 'learning_rate':[0.03, 0.04, 0.05, 0.06, 0.07, 0.08, 0.09, 0.1, 0.12, 0.13, 0.14, 0.15, 0.16, 0.17, 0.18, 0.19, 0.2],
                 'min_child_weight':list(range(2, 8, 2)),
                 'n_estimators':list(range(10, 101, 10))})

gsCv.fit(x_train, y_train)
print(gsCv.best_params_)
cv_results = pd.DataFrame(gsCv.cv_results_)
path = r"paramRank.csv"
cv_results.to_csv(path, index=False)

# 可视化
plt.figure()
plt.bar(range(len(model.feature_importances_)), model.feature_importances_)
plt.xlabel("Feature")
plt.ylabel("Feature Score")
plt.title("Feature Importance")
plt.savefig("Xgboost")

# 可视化
plt.figure()
plt.barh(label[::-1], x_score[:30][::-1], 0.6, align='center')
plt.grid(ls=':', color='gray', alpha=0.4)
plt.title("Xgboost Feature Importance")
# 添加数据标签
# for a, b in enumerate(rf_score[:30][::-1]):
#     plt.text(b+0.1, a-0.6/2, '%s' % b, ha='center', va='bottom')

plt.savefig("前30名特征")
plt.show()
注意:该算法没有数据是不能运行的,需要做适当的修改,后面使用网格调参,找到最优参数。
(4) 算法可视化

