一、代码
  1 app.title = '通讯盒各版本用户占比';
  2
  3 option = {
  4      backgroundColor: '#0f0f31',
  5     title: {
  6         show:true,
  7         x:"left",
  8         text: '通讯盒各版本用户占比',
  9         textStyle:{
 10             fontSize:16
 11             ,fontWeight:'normal'
 12             ,color:'#72a1d2'
 13         },
 14         left:20,
 15         top:10,
 16         borderColor :'#10395c',
 17         borderWidth :2,
 18     },
 19     tooltip: {
 20         trigger: 'item',
 21         formatter: "{a} <br/>{b}: {c} ({d}%)"
 22     },
 23     series: [
 24         {
 25             name:'通讯盒各版本用户占比',
 26             type:'pie',
 27             radius:['10%','18%'],
 28             avoidLabelOverlap:false,
 29             color:['#32A8FF',' #02C800','#9f47fd'],
 30             formatter: '{b}: {d}',
 31             markLine :{
 32                 label  :{
 33                     show:true,
 34                     position :'outside'
 35                 },
 36             },
 37             labelLine:{
 38                 normal:{
 39                     length:14  ,
 40                     length2 :56,
 41                 }
 42             },
 43             label :{
 44                  formatter: [
 45                     '{d}%',
 46                     '{b}'
 47                 ].join('
'),
 48                 verticalAlign :'bottom',
 49                 position:'outside',
 50                 //textShadowOffsetY :10,
 51                 align :'right',
 52                 color:'white',
 53                 height :36,
 54                  rich: {
 55                     a: {
 56                         verticalAlign:'bottom',
 57                         // 没有设置 `verticalAlign`,则 `verticalAlign` 为 bottom
 58                     }
 59                 }
 60             },
 61
 62             data:[{value:68,name:'YBT1',label: {
 63                 normal: {
 64                    textStyle: {
 65                         color: '#508DFF'  // 改变标示文字的颜色
 66                    }
 67                 }
 68             },itemStyle:{
 69                 normal:{
 70                     color: new echarts.graphic.LinearGradient(1, 0, 0, 0, [{
 71                         //颜色渐变函数 前四个参数分别表示四个位置依次为左、下、右、上
 72
 73                         offset: 0,
 74                         color: '#508DFF'
 75                     }, {
 76                         offset: 1,
 77                         color: '#26C5FE'
 78                     }])
 79                 }
 80             }},{value:18,name:'YBT2',label: {
 81                 normal: {
 82                    textStyle: {
 83                         color: '#63E587'  // 改变标示文字的颜色
 84                    }
 85                 }
 86             },itemStyle:{
 87                 normal:{
 88                     color: new echarts.graphic.LinearGradient(1, 0, 0, 0, [{
 89                         //颜色渐变函数 前四个参数分别表示四个位置依次为左、下、右、上
 90
 91                         offset: 0,
 92                         color: '#63E587'
 93                     }, {
 94                         offset: 1,
 95                         color: '#5FE2E4'
 96                     }])
 97                 }
 98             }},{value:14,name:'YBT3',label: {
 99                 normal: {
100                    textStyle: {
101                         color: '#9f47fd'  // 改变标示文字的颜色
102                    }
103                 }
104             },itemStyle:{
105                 normal:{
106                     color: new echarts.graphic.LinearGradient(1, 0, 0, 0, [{
107                         //颜色渐变函数 前四个参数分别表示四个位置依次为左、下、右、上
108                         offset: 0,
109                         color: '#9f47fd'
110                     }, {
111                         offset: 1,
112                         color: '#9f47fd'
113                     }])
114                 }
115             }}]
116         },{
117             name:'',
118             type:'pie',
119             radius:['8%','10%'],
120             avoidLabelOverlap:false,
121             legendHoverLink :false,
122             label:{
123               show:false,
124             },
125             tooltip:{//禁止鼠标悬停显示提示框
126                 show:false,
127             },
128             hoverAnimation:false ,//禁止鼠标悬停放大区域
129             color:['#bcdbfa'],
130             data:[{value:'100'}]
131         }
132     ]
133 };
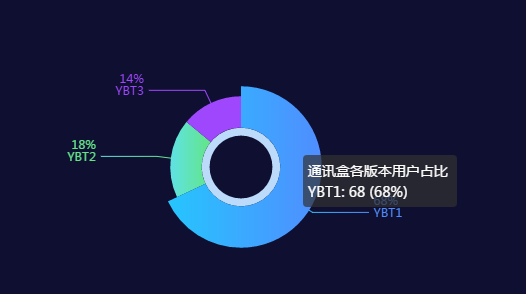
二、效果图