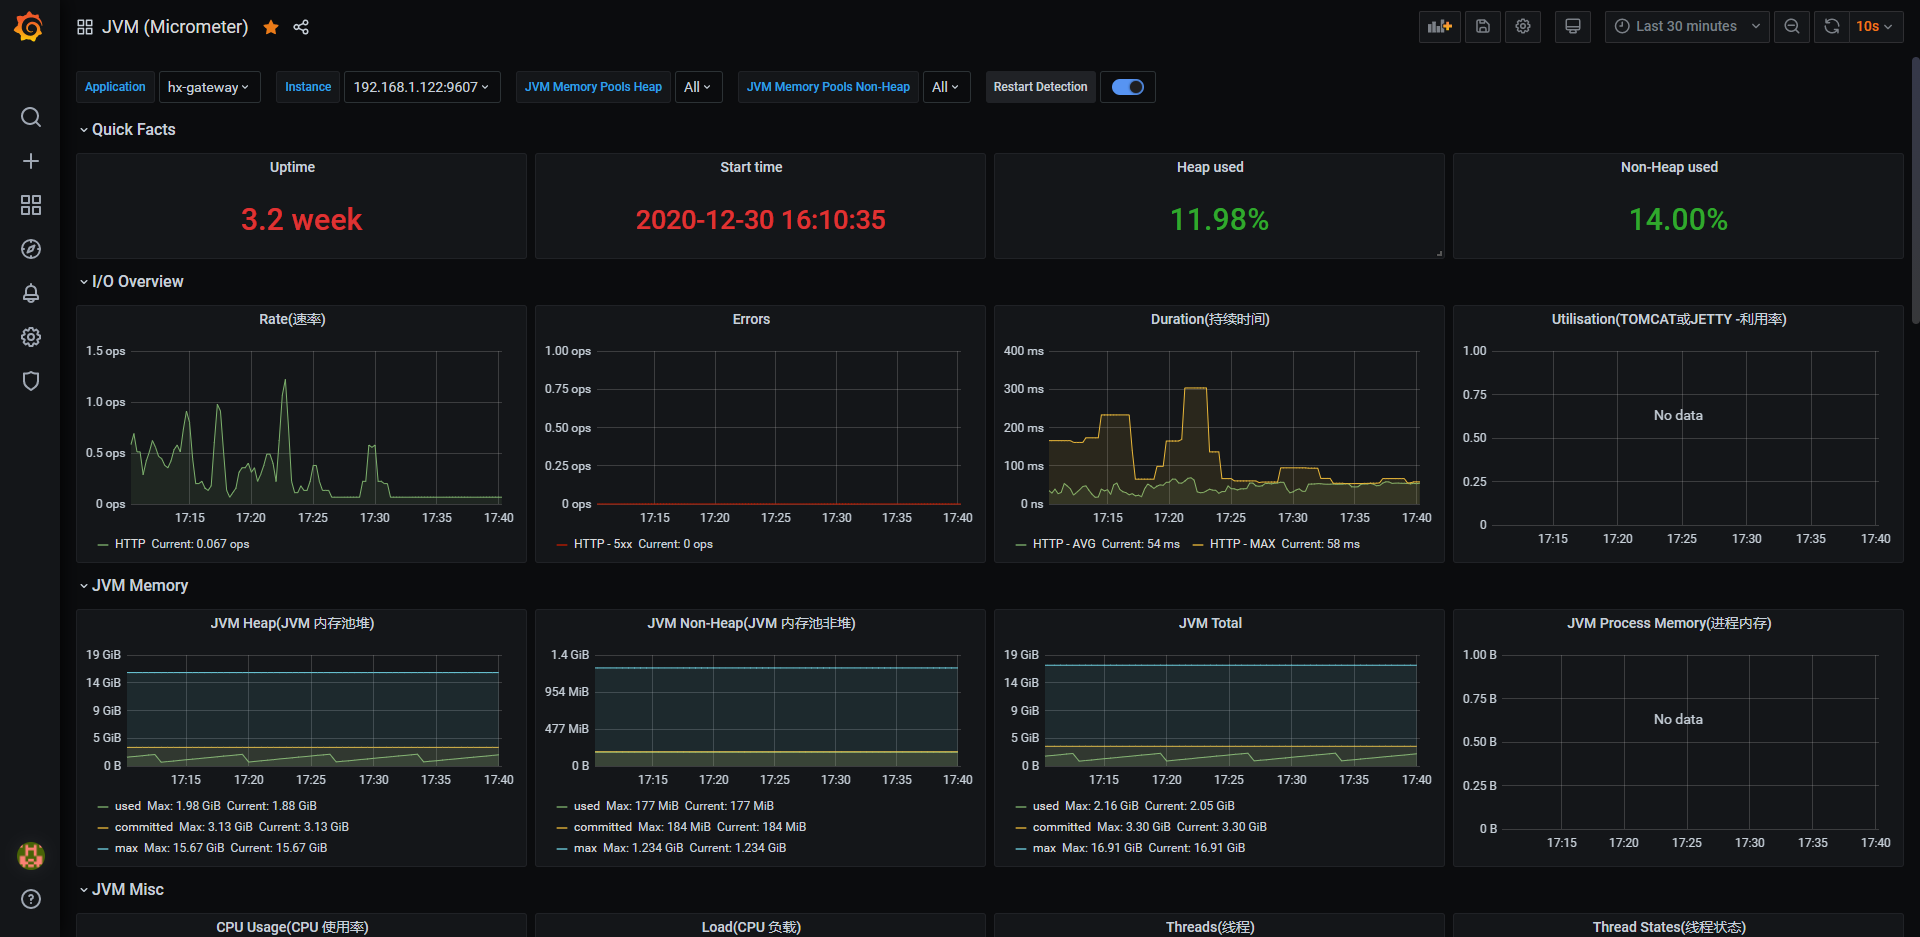
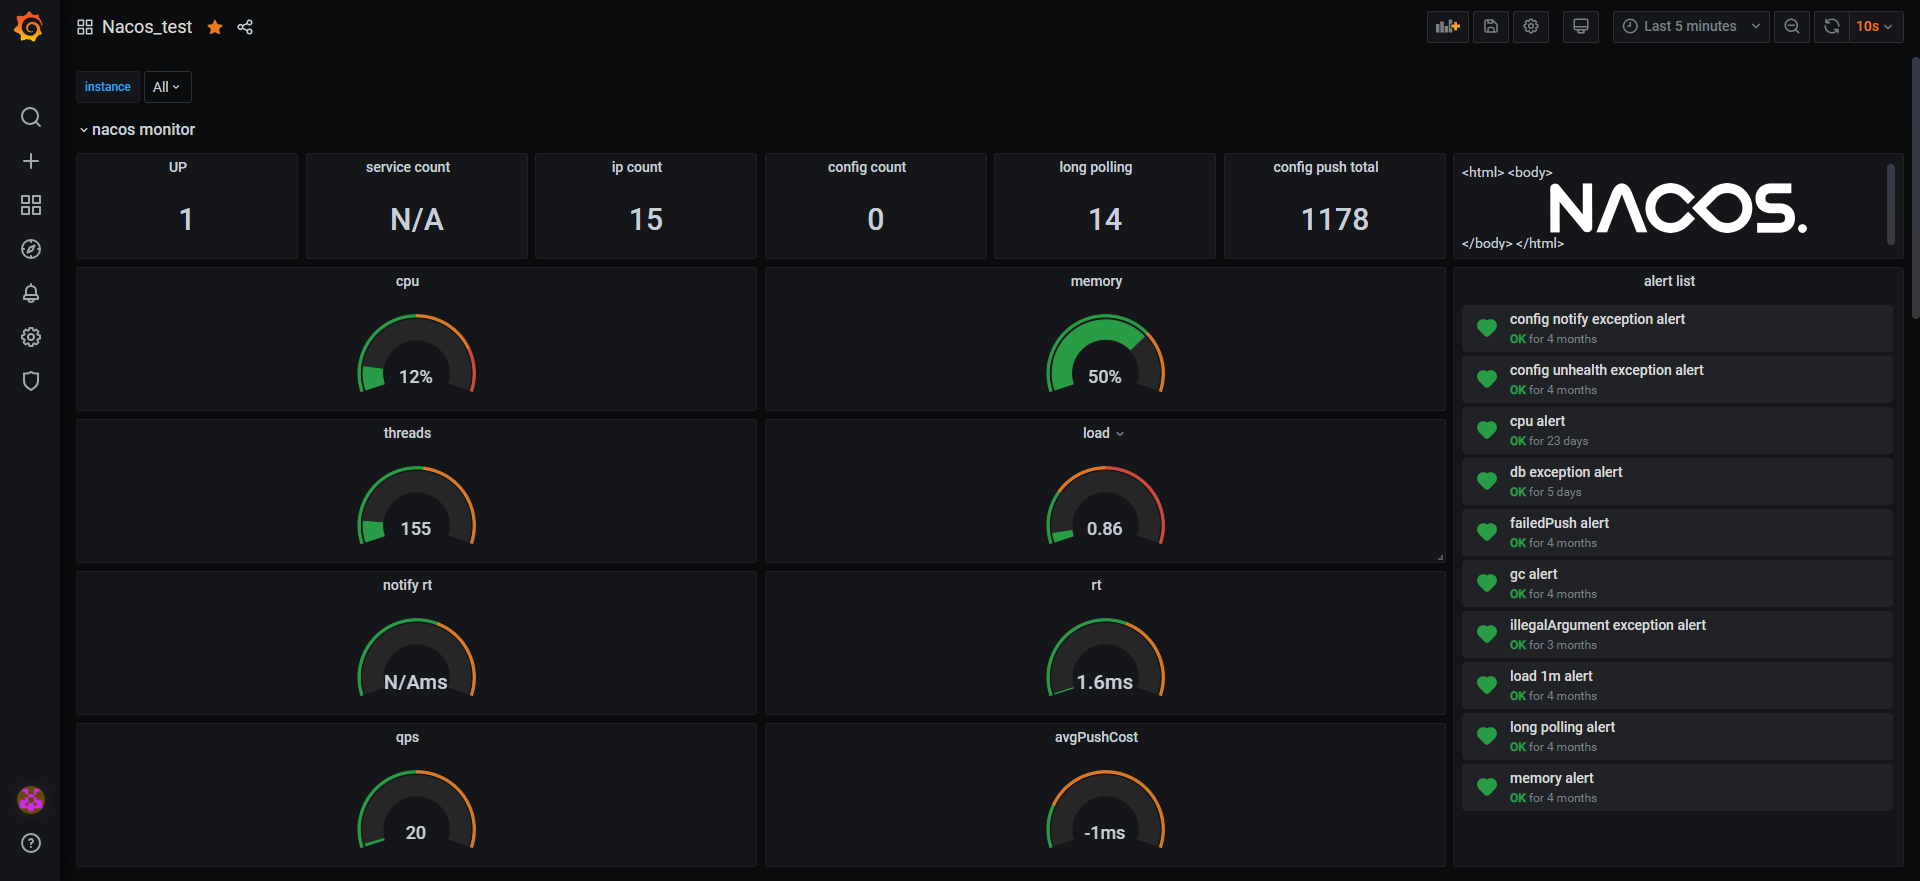
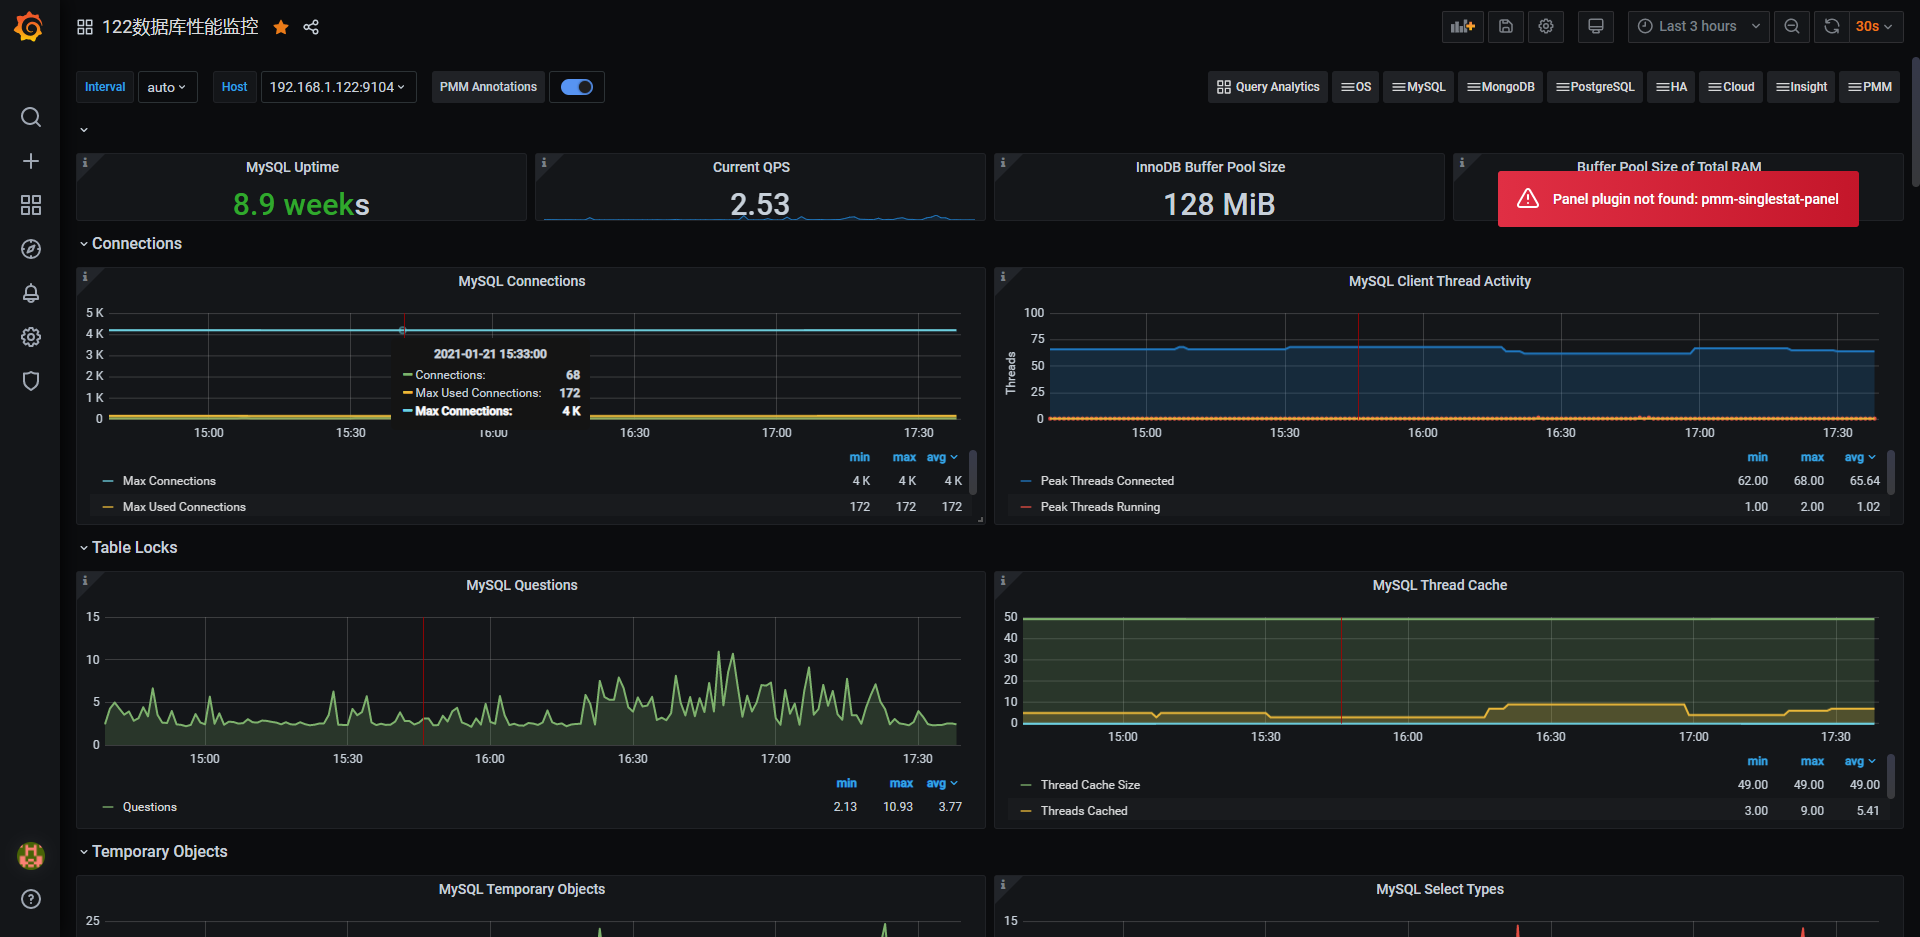
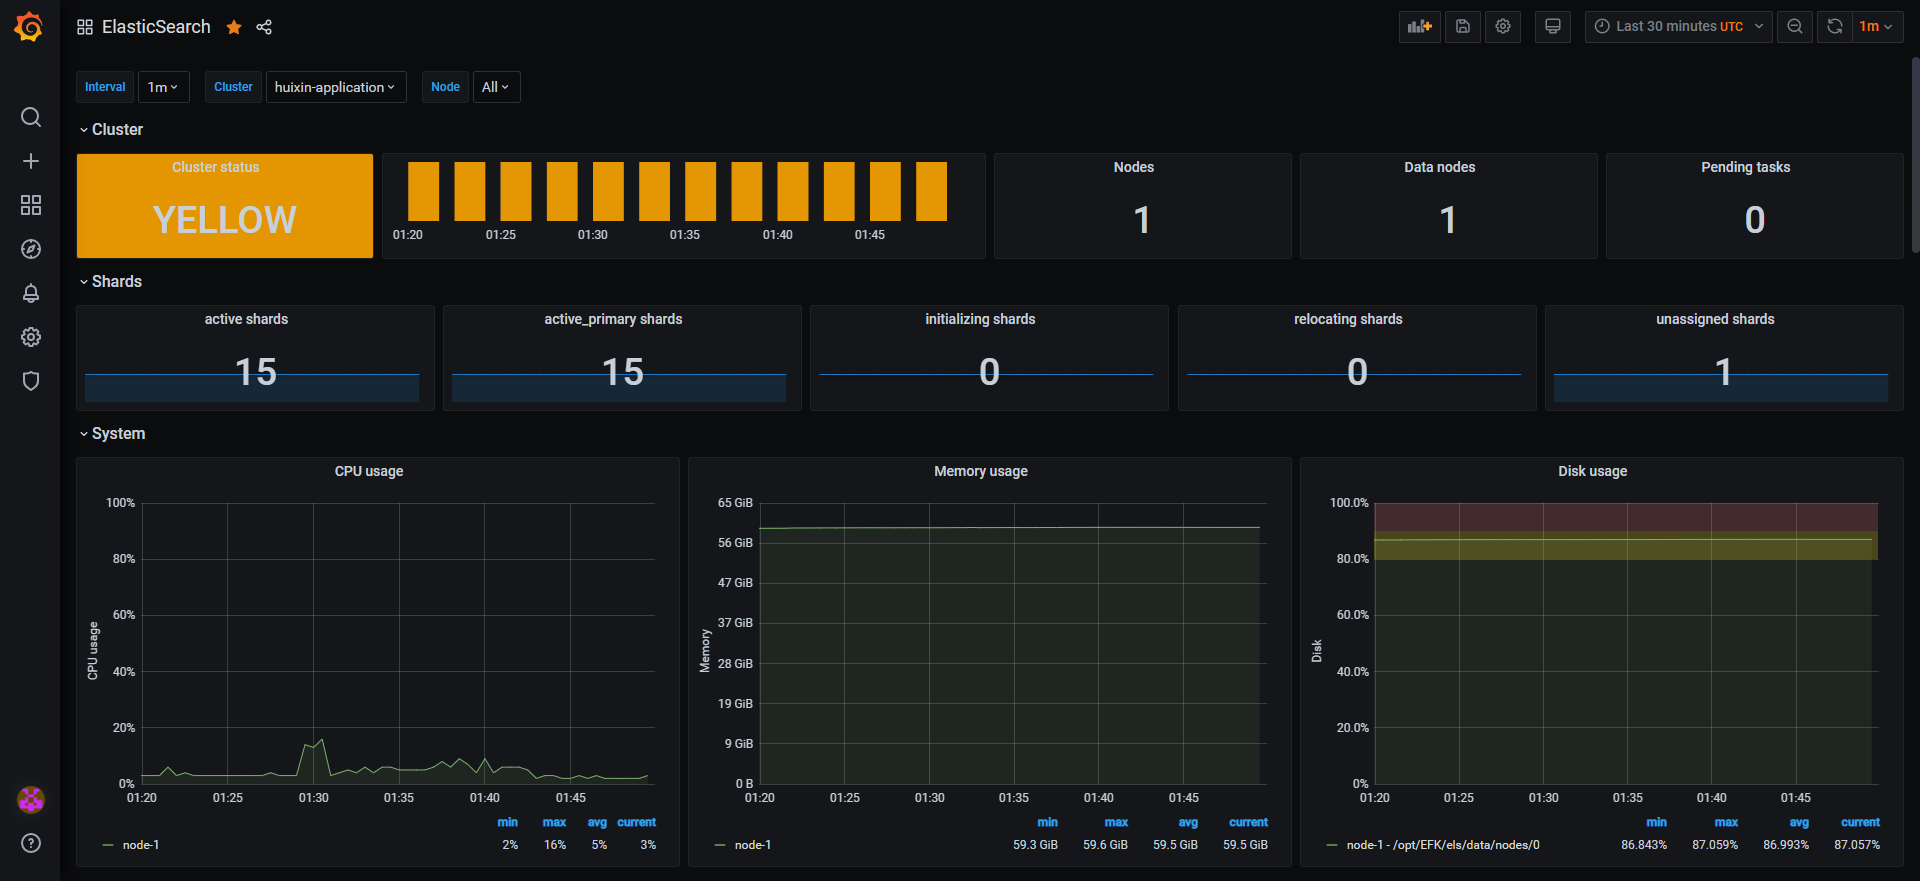
Prometheus监控之grafana常用模板编号记录 grafana常用模板记录。 1.服务器系统性能监控:8919 2.微服务性能监控:4701 3.docker环境性能监控:893 4.nacos性能监控:13221 5.mysql性能监控:9362 6.elasticsearch:266