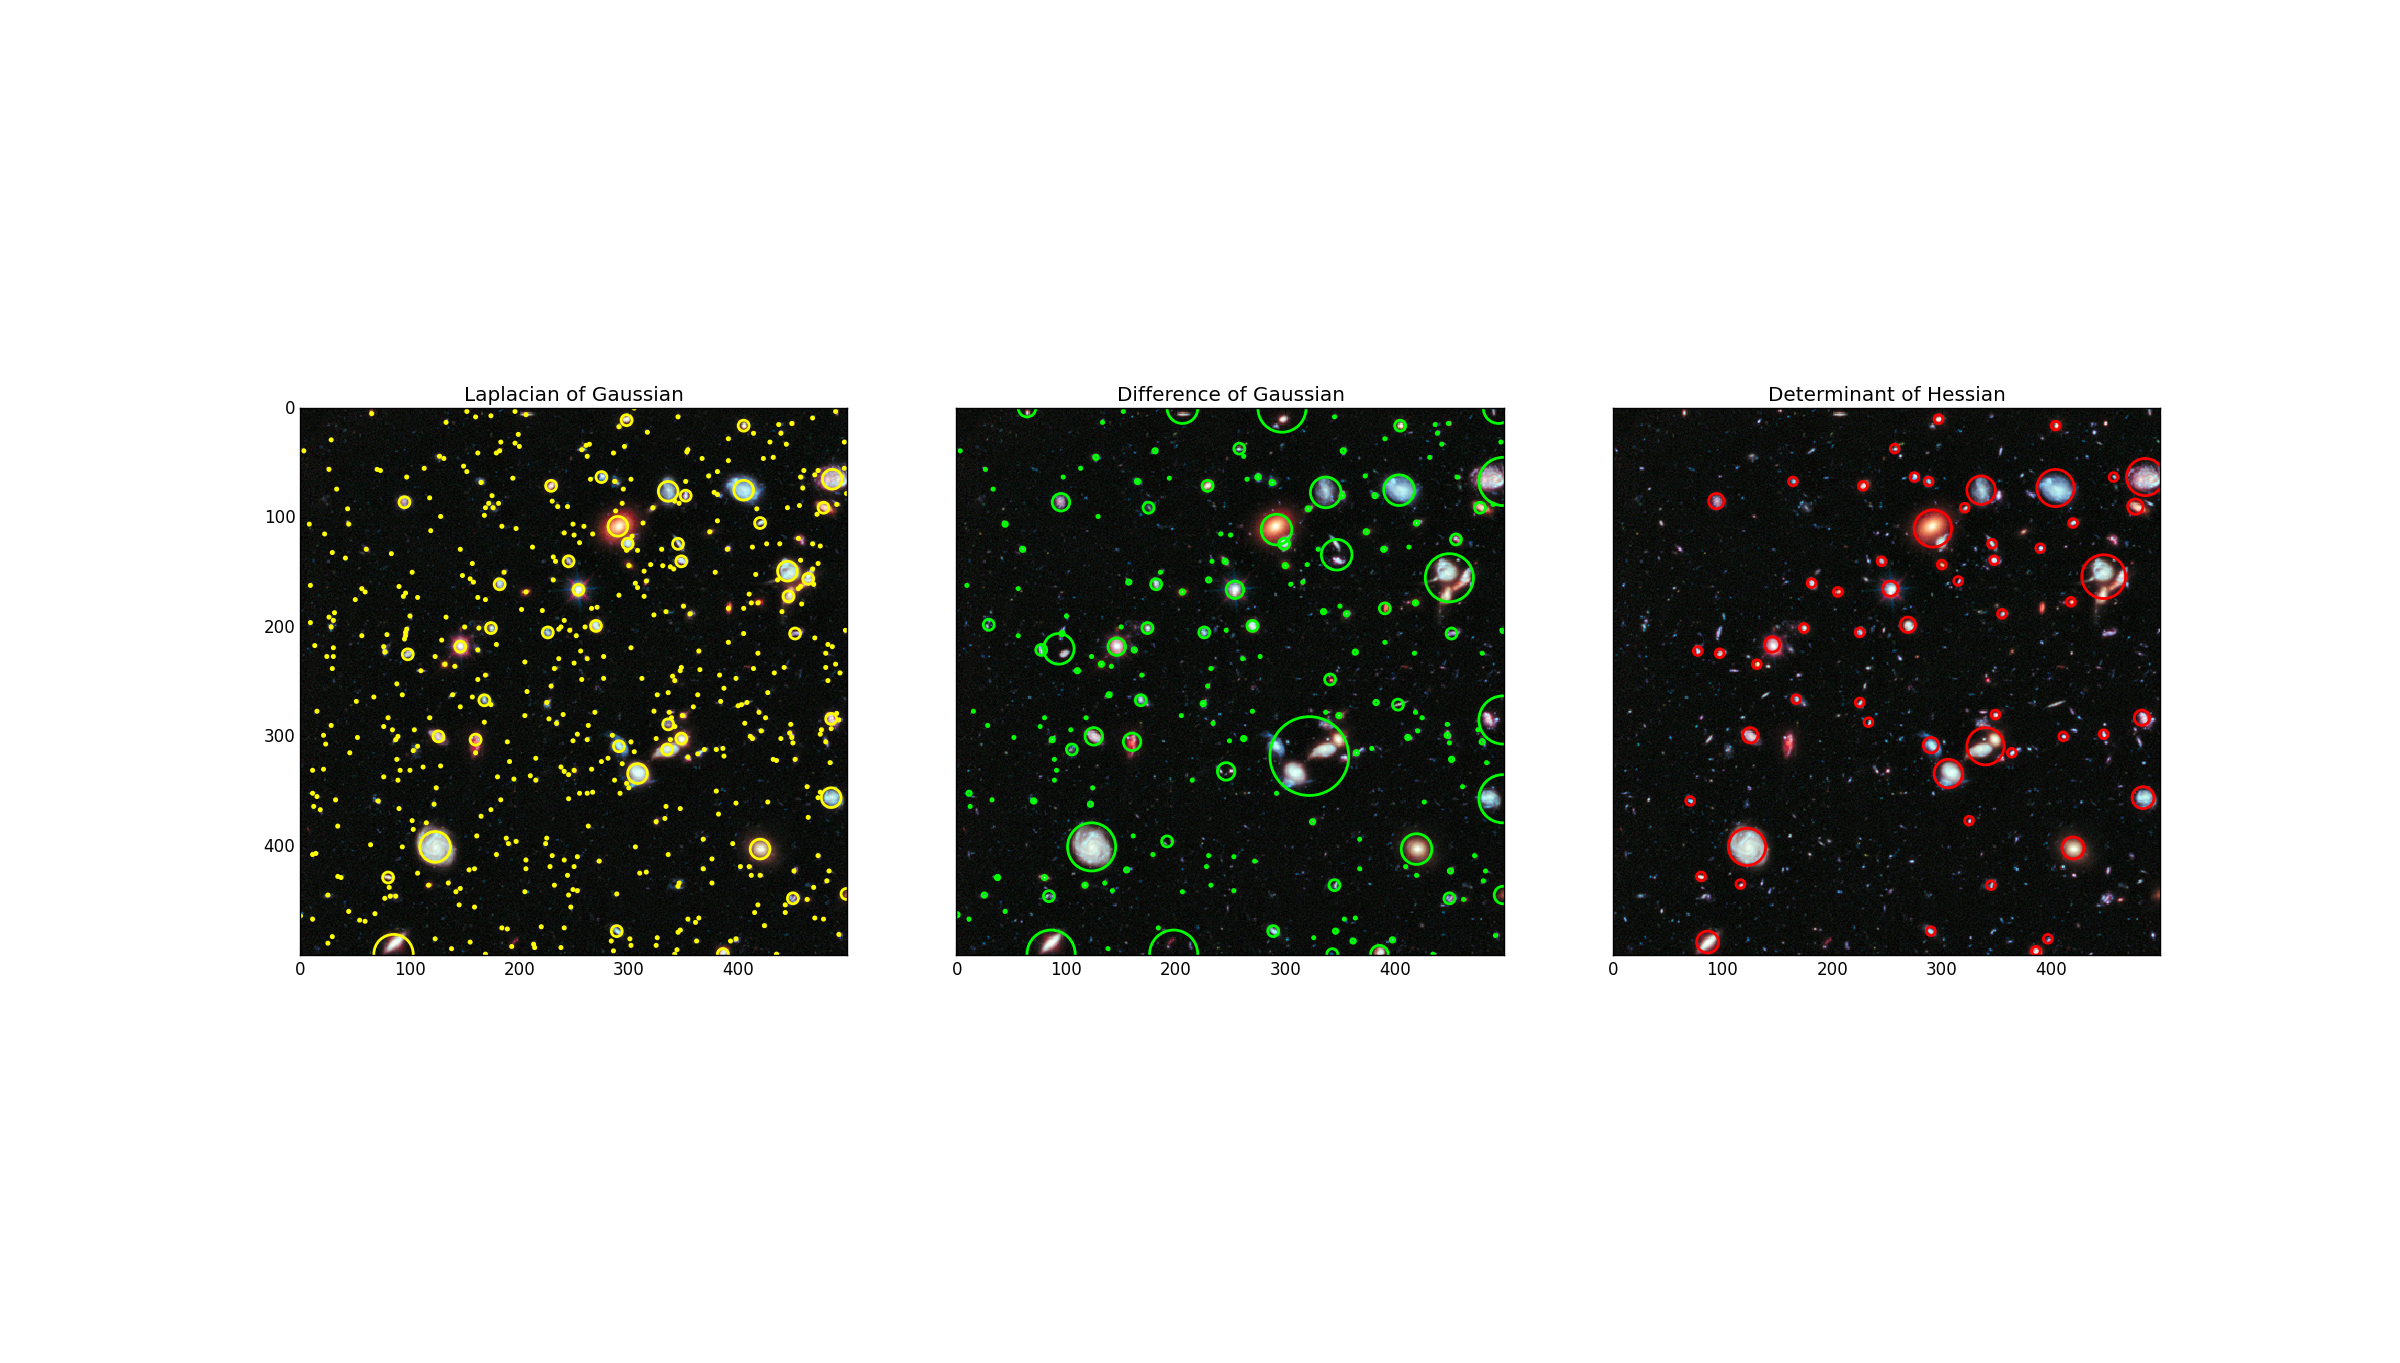
这个用例主要介绍利用三种算法对含有blob的图像进行检测,blob 或者叫斑点,就是在一幅图像上,暗背景上的亮区域,或者亮背景上的暗区域,都可以称为blob。主要利用blob与背景之间的对比度来进行检测。这个用例介绍了三种算法;
Laplacian of Gaussian (LoG)
这是速度最慢,但是最准确的一种算法,简单来说,就是对一幅图先进行一系列不同尺度的高斯滤波,然后对滤波后的图像做Laplacian运算,将所有的图像进行叠加,局部最大值就是所要检测的blob,这个算法对于大的blob检测会很慢,还有就是该算法适合于检测暗背景下的亮blob。
Difference of Gaussian (DoG)
这是LoG算法的一种快速近似,对图像进行高斯滤波之后,不做Laplacian运算,直接做减法,相减后的图做叠加,找到局部最大值,这个算法的缺陷与LoG类似。
Determinant of Hessian (DoH)
这是最快的一种算法,不需要做多尺度的高斯滤波,运算速度自然提升很多,这个算法对暗背景上的亮blob或者亮背景上的暗blob都能检测。缺点是小尺寸的blob检测不准确。
P.S. LoG 和 DoG 如果想检测亮背景上的暗blob,可以将图像做反相,这样亮背景就变成了暗背景,而暗blob就变成了亮blob,然后就可以用这两个算法了,检测完之后再反回来就好了。
from matplotlib import pyplot as plt
from skimage import data
from skimage.feature import blob_dog, blob_log, blob_doh
from math import sqrt
from skimage.color import rgb2gray
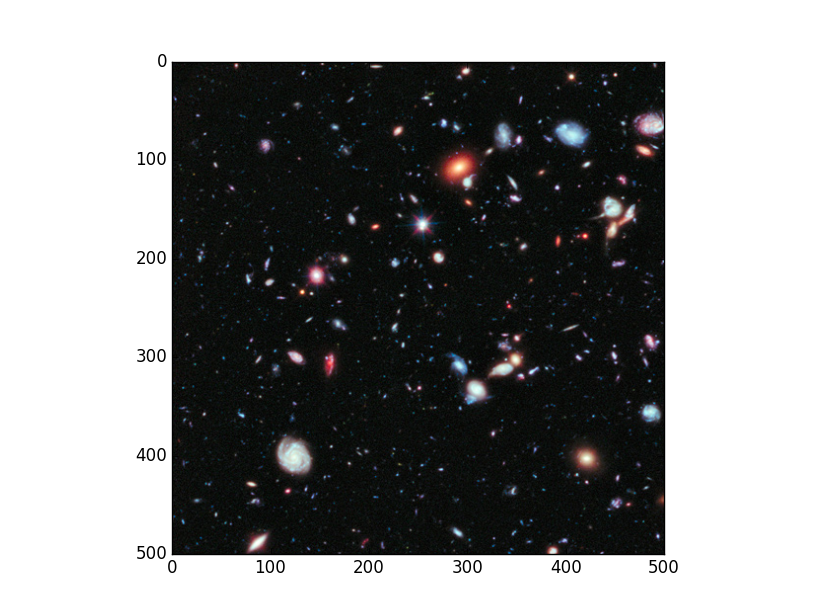
image = data.hubble_deep_field()[0:500, 0:500]
image_gray = rgb2gray(image)
plt.imshow(image)
blobs_log = blob_log(image_gray, max_sigma=30, num_sigma=10, threshold=.1)
# Compute radii in the 3rd column.
blobs_log[:, 2] = blobs_log[:, 2] * sqrt(2)
blobs_dog = blob_dog(image_gray, max_sigma=30, threshold=.1)
blobs_dog[:, 2] = blobs_dog[:, 2] * sqrt(2)
blobs_doh = blob_doh(image_gray, max_sigma=30, threshold=.01)
blobs_list = [blobs_log, blobs_dog, blobs_doh]
colors = ['yellow', 'lime', 'red']
titles = ['Laplacian of Gaussian', 'Difference of Gaussian',
'Determinant of Hessian']
sequence = zip(blobs_list, colors, titles)
fig,axes = plt.subplots(1, 3, sharex=True, sharey=True, subplot_kw={'adjustable':'box-forced'})
axes = axes.ravel()
for blobs, color, title in sequence:
ax = axes[0]
axes = axes[1:]
ax.set_title(title)
ax.imshow(image, interpolation='nearest')
for blob in blobs:
y, x, r = blob
c = plt.Circle((x, y), r, color=color, linewidth=2, fill=False)
ax.add_patch(c)
plt.show()参考来源: http://scikit-image.org/docs/dev/auto_examples/
原图:
效果图: