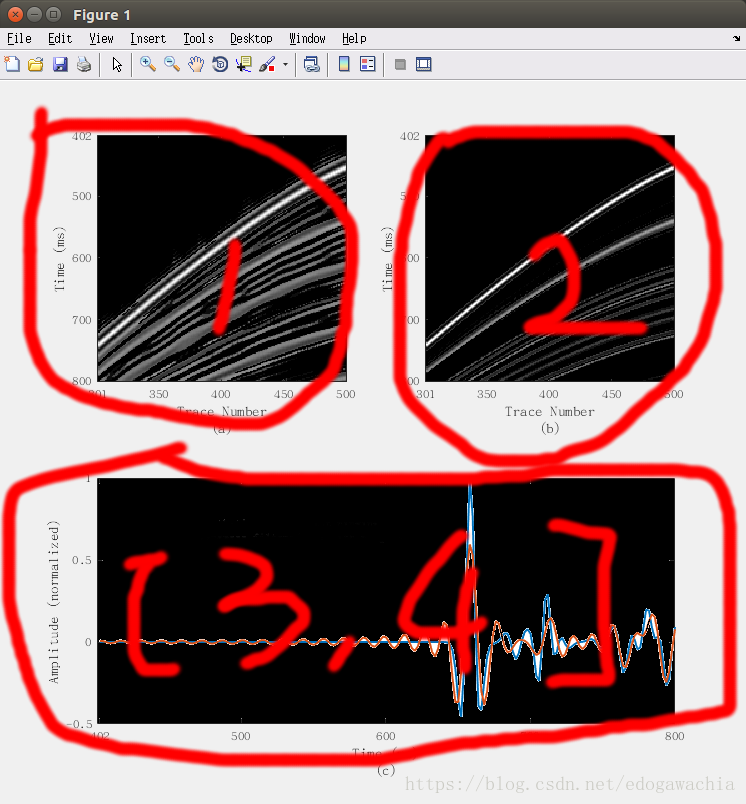
MATLAB作图时,如果带有子图,可用subplot作图。如果需要一个规则的网格,直接制定subplot(m,n,p),即可画出m×n的子图排列中的第p个。但是如果需要不规则的,如2×2的格子中,两个小图分别占上面的两个subplot,一个长图要占据下面两个格子,此时要用subplot(2,2,[3,4])来实现。
如果选定的 [ ] 内的两个数不在同一个行列,那么就表示以小数作为左上角,大数作为右下角的矩形框围成的区域。
% 一个栗子
figure;
subplot(2,2,1)
imagesc(synring(t0:t1,x0:x1))
set(gca,'xtick',[1,50:50:200])
set(gca,'xticklabel',[301,350:50:500])
set(gca,'ytick',[1,50:50:200])
set(gca,'yticklabel',[201,250:50:400] .* dt)
xlabel({'Trace Number';'(a)'})
ylabel('Time (ms)')
colormap(gray)
subplot(2,2,2)
imagesc(synsection(t0:t1,x0:x1))
set(gca,'xtick',[1,50:50:200])
set(gca,'xticklabel',[301,350:50:500])
set(gca,'ytick',[1,50:50:200])
set(gca,'yticklabel',[201,250:50:400] .* dt)
xlabel({'Trace Number';'(b)'})
ylabel('Time (ms)')
colormap(gray)
subplot(2,2,[3,4])
h1 = plot(t0:t1,synsection(t0:t1,selected_trace));
hold on
h2 = plot(t0:t1,synring(t0:t1,selected_trace));
set(h1,'LineWidth',1.5)
set(h2,'LineWidth',1.5)
set(gca,'xtick',[201,250:50:400])
set(gca,'xticklabel',[201,250:50:400] .* dt)
xlabel({'Time (ms)';'(c)'})
ylabel('Amplitude (normalized)')
h = legend('synthetic data without ringing', 'bandpass filtereddata with ringing');
set(h,'Box','off')
set(h, 'Fontsize',9)
colormap(gray)