一、代码
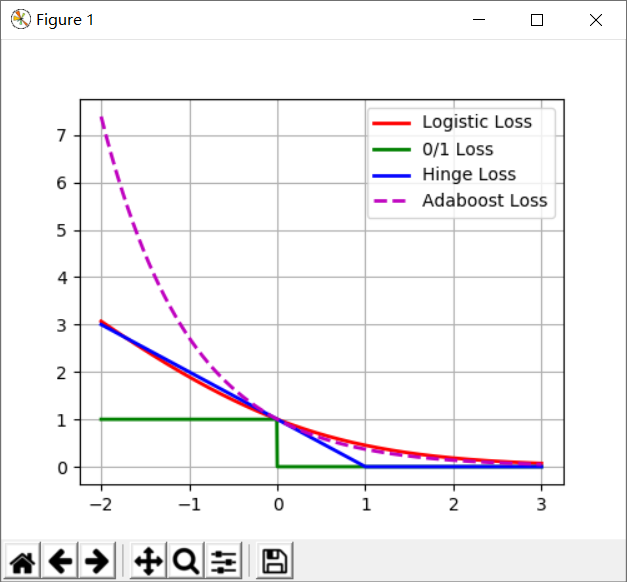
# 损失函数:Logistic损失(-1,1)/SVM Hinge损失/ 0/1损失
import numpy as np
import matplotlib.pyplot as plt
import math

plt.figure(figsize=(5,4))
x = np.linspace(start=-2, stop=3, num=1001, dtype=np.float)
y_logit = np.log(1 + np.exp(-x)) / math.log(2)
y_boost = np.exp(-x)
y_01 = x < 0
y_hinge = 1.0 - x
y_hinge[y_hinge < 0] = 0
plt.plot(x, y_logit, 'r-', label='Logistic Loss', linewidth=2)
plt.plot(x, y_01, 'g-', label='0/1 Loss', linewidth=2)
plt.plot(x, y_hinge, 'b-', label='Hinge Loss', linewidth=2)
plt.plot(x, y_boost, 'm--', label='Adaboost Loss', linewidth=2)
plt.grid()
plt.legend(loc='upper right')
plt.savefig('1.png')
plt.show()
二、结果