在yAxis中插入:
axisLine: {show:false},
axisTick: {show:false},
yAxis : [
{
show:true,
axisLine: {show:false},
axisTick: {show:false},
splitLine:{show:false},
type : 'value',
min:"0",
max:100,
axisLabel:{
formatter: function (value) {
var texts = [];
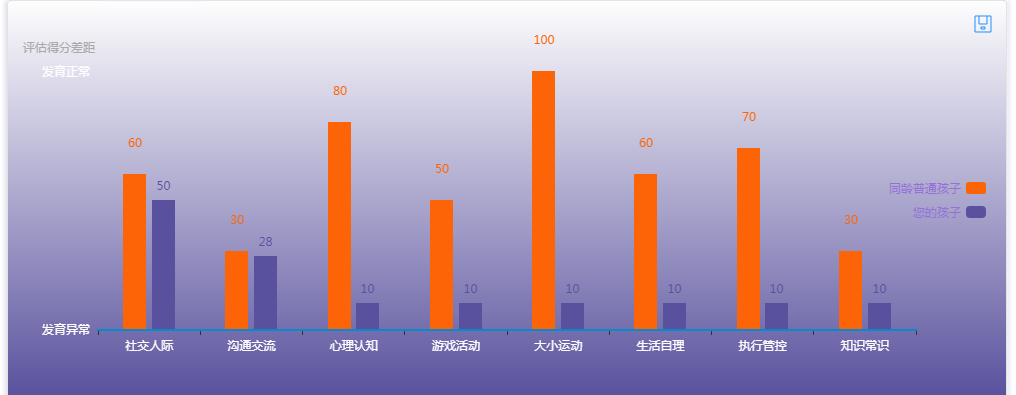
if(value==0){
texts.push('发育异常');
}
else if (value ==100 ){
texts.push('发育正常');
}
return texts;
},
textStyle: {
color: '#fff'
}
},
splitArea:{show:false}
}
],
添加前:

添加后: