1、首先设置 echarts 内容:
const myChart3 = this.$echarts.init(document.getElementById('myChart3'));
      myChart3.setOption({
        tooltip: {
        },
        grid:{
        },
        legend: {
          x: 'center',
          icon: "circle",
          itemWidth: 10,
          itemHeight: 10,
          textStyle: {
            fontSize: 12
          },
          data: ['成功笔数', '拒付笔数', '退款笔数', '拒付率']
        },
        calculable: true,
        triggerEvent: true,
        xAxis: [
          {
            type: 'category',
            // triggerEvent: true,
            data: date
          }
        ],
        yAxis: [
          {
            type: 'value',
            // triggerEvent: true,
            splitLine: {
              show: true,
              lineStyle: {
                type: 'dashed'
              }
            }
          },
          {
            splitLine: {
              show: true,
              lineStyle: {
                type: 'dashed'
              }
            },
            splitNumber: 6,
            type: 'value',
          }
        ],
        series: [
          {
            name: '成功笔数',
            type: 'bar',
            barWidth: 10,
            itemStyle: {
              normal: {
                color: '#2566FA',
                barBorderRadius: [10, 10, 0, 0],
              }
            },
            data: date_4,
            // data: [10,20,10,5,10,90,30],
            yAxisIndex: 0
          },
          {
            name: '拒付笔数',
            type: 'bar',
            barWidth: 10,
            itemStyle: {
              normal: {
                color: '#F71F45',
                barBorderRadius: [10, 10, 0, 0],
              }
            },
            data: data_1,
            // data: [10,20,10,5,10,90,30],
            yAxisIndex: 0
          },
          {
            name: '退款笔数',
            type: 'bar',
            barWidth: 10,
            itemStyle: {
              normal: {
                color: '#f7bb3d',
                barBorderRadius: [10, 10, 0, 0],
              }
            },
            data: data_2,
            // data: [10,20,10,5,10,90,30],
            yAxisIndex: 0
          },
          {
            name: '拒付率',
            type: "line",
            smooth: true,//平滑曲线
            itemStyle: {
              normal: {
                color: '#F99025'
              }
            },
            data: data_3,
            // data: [10,20,60,50,0,5,7],
            yAxisIndex: 1
          },
        ]
      });
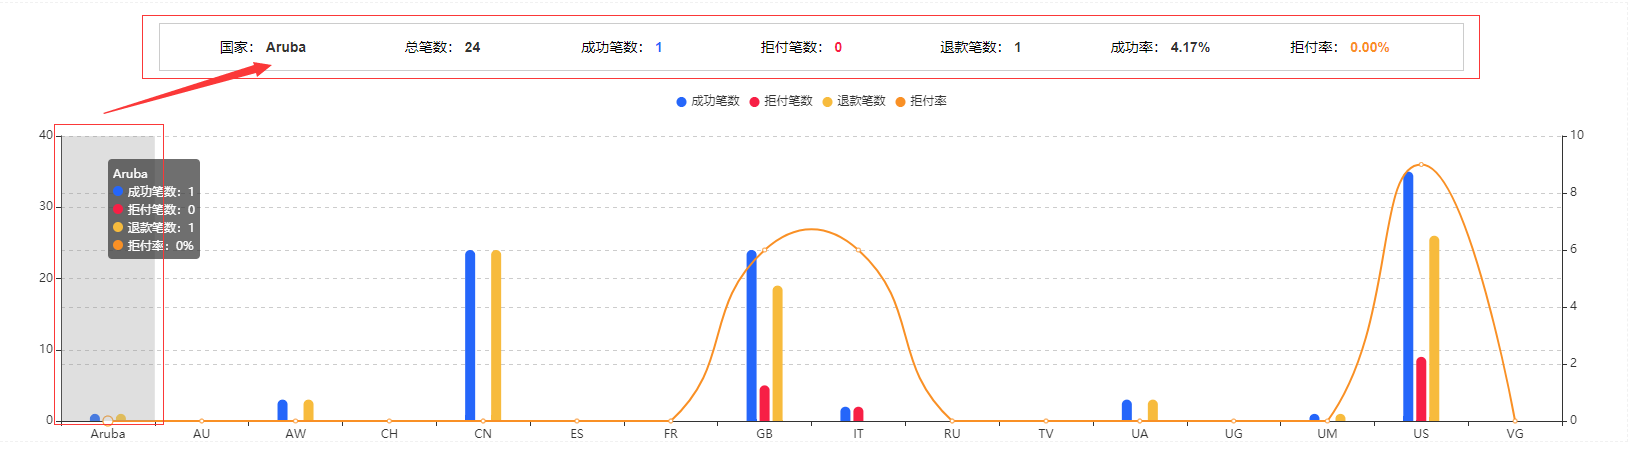
2、鼠标移入事件:
myChart3.getZr().on('mousemove', function(params) {
        this.newimgAnalysisList = [];
        let pointInPixel = [params.offsetX, params.offsetY];
        let pointInGrid = myChart3.convertFromPixel({seriesIndex: 0}, pointInPixel);
        let xIndex = pointInGrid[0];
        let op = myChart3.getOption();
        let machineName = op.xAxis[0].data[xIndex]; //获取x轴名字
        for(const i in this.imgAnalysisList) { //根据x轴名字,匹配后端返回过来的数据
          if(!this.imgAnalysisList.hasOwnProperty(i)) continue;
          if(machineName === this.imgAnalysisList[i].country) {
            this.newimgAnalysisList.push(this.imgAnalysisList[i]);
          }
        }
      });
3、若获取不到 vue 下的 data,则需要把 myChart3.getZr().on('mousemove', function(params){.....} 改成: myChart3.getZr().on('mousemove', (params) => {}) 箭头函数即可。
4、.getZr() :指的是当去掉它的时候,鼠标 点击/移入 等事件,只能在点上,加上它的时候,则可以把事件绑定为整个灰色区域

5、另:echarts 支持的常见鼠标事件类型有, “ click ”、“ dblclick ”、“ mousedown ”、“ mousemove ”、“ mouseup ”、" mouseover "、" mouseout "、" globalout "、" contextmenu " 事件,可根据需要修改。