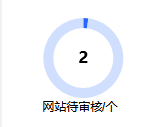
echarts pie 圆环图中间显示数据

series : [
            {
              type : 'pie',
              hoverAnimation: false,
              center : ['16%', '20%'],
              radius : radius,
              label: { //  饼图图形上的文本标签
                normal: { // normal 是图形在默认状态下的样式
                  show: true,
                  position: 'center',
                  color: '#000',
                  fontSize: 16,
                  fontWeight: 'bold',
                  formatter: '{c}' // {b}:数据名; {c}:数据值; {d}:百分比,可以自定义显示内容,
                }
              },
              data : [
                {name:'GoogleMaps',
                  value: parseInt(data_1),
                  itemStyle : {
                    normal: {
                      color: '#2866FF',
                      label: {
                        normal: {show: true}
                      }
                    }
                  }
                },
                {name:'other',value:100 - parseInt(data_1), itemStyle : labelBottom, label: { normal: { show: false}}}
              ]
            },

效果展示: 
  

原文地址:https://www.cnblogs.com/moguzi12345/p/13521559.html