1.导入数据
批量导入数据并查看
1.1 导入数据
1) 使用POST方式批量导入数据,数据格式为json,url 编码使用data-binary导入含有index配置的json文件
]# scp /var/ftp/elk/*.gz 192.168.1.66:/root/
kibana ~]# gzip -d logs.jsonl.gz
kibana ~]# gzip -d accounts.json.gz
kibana ~]# gzip -d shakespeare.json.gz
kibana ~]# curl -X POST "http://192.168.1.61:9200/_bulk"
--data-binary @shakespeare.json
kibana ~]# curl -X POST "http://192.168.1.61:9200/xixi/haha/_bulk"
--data-binary @accounts.json
//索引是xixi,类型是haha,必须导入索引和类型,没有索引,要加上
kibana ~]# curl -X POST "http://192.168.1.61:9200/_bulk"
--data-binary @logs.jsonl
2)使用GET查询结果
kibana ~]# curl -XGET 'http://192.168.1.61:9200/_mget?pretty' -d '{
"docs":[
{
"_index":"shakespeare",
"_type:":"act",
"_id":0
},
{
"_index":"shakespeare",
"_type:":"line",
"_id":0
},
{
"_index":"xixi",
"_type:":"haha",
"_id":25
}
]
}'
1.2 使用kibana查看数据是否导入成功
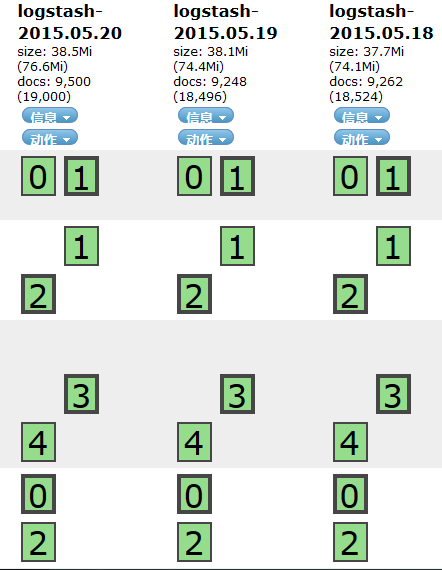
1)数据导入以后查看logs是否导入成功,如图所示:
]# firefox http://192.168.1.65:9200/_plugin/head/
2)kibana导入数据,如图-2所示:
kibana ~]# firefox http://192.168.1.66:5601
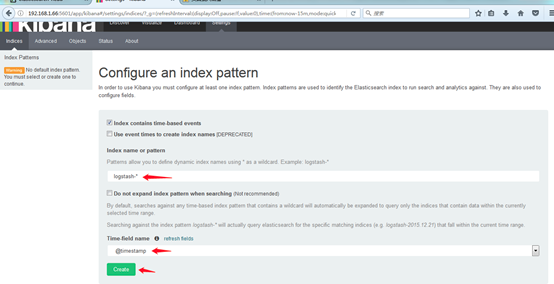
3)成功创建会有logstash-*
4)导入成功之后选择Discover,如图-4所示:
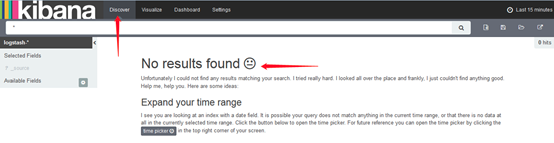
注意: 这里没有数据的原因是导入日志的时间段不对,默认配置是最近15分钟,在这可以修改一下时间来显示
5)kibana修改时间,选择Lsat 15 miuntes--选择Absolute--选择时间2015-5-15到2015-5-22,返回,查看结果

6)除了柱状图,Kibana还支持很多种展示方式,选择visualize--Forms a new Search
查看前六名访问网页的国家:
buckets--Split Slices --Terms--Fieled--geo.rsc--Count-Size(6)
查看访问网页的人都用什么操作系统的机器
buckets--小按钮折叠上一个--Split Slices --Terms--Fieled--machine.os--Count-Size(前5)
2. 综合练习
练习插件
安装一台Apache服务并配置
使用filebeat收集Apache服务器的日志
使用grok处理filebeat发送过来的日志
存入elasticsearch
2.1 安装logstash
1)配置主机名,ip和yum源,配置/etc/hosts(请把se1-se5和kibana主机配置和logstash一样的/etc/hosts)
logstash ~]# vim /etc/hosts
192.168.1.61 se1
192.168.1.62 se2
192.168.1.63 se3
192.168.1.64 se4
192.168.1.65 se5
192.168.1.66 kibana
192.168.1.67 logstash
2)安装java-1.8.0-openjdk和logstash
logstash ~]# yum -y install java-1.8.0-openjdk
logstash ~]# yum -y install logstash
logstash ~]# java -version
openjdk version "1.8.0_131"
OpenJDK Runtime Environment (build 1.8.0_131-b12)
OpenJDK 64-Bit Server VM (build 25.131-b12, mixed mode)
logstash ~]# touch /etc/logstash/logstash.conf
logstash ~]# /opt/logstash/bin/logstash --version
logstash 2.3.4
logstash ~]# /opt/logstash/bin/logstash-plugin list //查看插件
...
logstash-input-stdin //标准输入插件
logstash-output-stdout //标准输出插件
...
logstash ~]# vim /etc/logstash/logstash.conf
input{
stdin{
}
}
filter{
}
output{
stdout{
}
}
//启动并测试
logstash ~]# /opt/logstash/bin/logstash -f /etc/logstash/logstash.conf
Settings: Default pipeline workers: 2
Pipeline main started
aa
2019-03-01T08:36:25.227Z logstash aa
bb
2019-03-01T08:36:29.282Z logstash bb
备注:若不会写配置文件可以找帮助,插件文档的位置:
3)codec类插件
logstash ~]# vim /etc/logstash/logstash.conf
input{
stdin{
codec => "json" //输入设置为编码json
}
}
filter{
}
output{
stdout{
codec => "rubydebug" //输出设置为rubydebug
}
}
logstash ~]# /opt/logstash/bin/logstash -f /etc/logstash/logstash.conf
Settings: Default pipeline workers: 2
Pipeline main started
{"a":1}(手打)
{
"a" => 1,
"@version" => "1",
"@timestamp" => "2019-03-01T08:39:23.978Z",
"host" => "logstash"
}
4)file模块插件
logstash ~]# vim /etc/logstash/logstash.conf
input{
file {
path => [ "/tmp/a.log", "/var/tmp/b.log" ]
sincedb_path => "/var/lib/logstash/sincedb" //记录读取文件的位置
start_position => "beginning" //配置第一次读取文件从什么地方开始
type => "testlog" //类型名称
}
}
filter{
}
output{
stdout{
codec => "rubydebug"
}
}
logstash ~]# touch /tmp/a.log
logstash ~]# touch /var/tmp/b.log
logstash ~]# /opt/logstash/bin/logstash -f /etc/logstash/logstash.conf
(已经在检测中)
另开一个终端:写入数据
logstash ~]# echo a1 > /tmp/a.log
logstash ~]# echo b1 > /var/tmp/b.log
显示数据:
Settings: Default pipeline workers: 2
Pipeline main started
{
"message" => "a1",
"@version" => "1",
"@timestamp" => "2019-03-01T08:43:38.633Z",
"path" => "/tmp/a.log",
"host" => "logstash",
"type" => "testlog"
}
{
"message" => "b1",
"@version" => "1",
"@timestamp" => "2019-03-01T08:43:52.671Z",
"path" => "/var/tmp/b.log",
"host" => "logstash",
"type" => "testlog"
}
5)tcp、udp模块插件
logstash ~]# vim /etc/logstash/logstash.conf
input{
file {
path => [ "/tmp/a.log", "/var/tmp/b.log" ]
sincedb_path => "/var/lib/logstash/sincedb"
start_position => "beginning"
type => "testlog"
}
tcp {
host => "0.0.0.0"
port => "8888"
type => "tcplog"
}
udp {
host => "0.0.0.0"
port => "9999"
type => "udplog"
}
}
filter{
}
output{
stdout{
codec => "rubydebug"
}
}
logstash ~]# /opt/logstash/bin/logstash -f /etc/logstash/logstash.conf
//启动,监控中
另开一个终端查看,可以看到端口
logstash tmp]# netstat -antup | grep 8888
tcp6 0 0 :::8888 :::* LISTEN 22191/java
logstash tmp]# netstat -antup | grep 9999
udp6 0 0 :::9999 :::* 22191/java
在另一台主机上写一个脚本,发送数据,使启动的logstash可以接收到数据
se5 ~]# vim tcp.sh
function sendmsg(){
if [[ "$1" == "tcp" ]];then
exec 9<>/dev/tcp/192.168.1.67/8888
else
exec 9<>/dev/udp/192.168.1.67/9999
fi
echo "$2" >&9
exec 9<&-
}
se5 ~]# . tcp.sh //重新载入一下
se5 ~]# sendmsg udp "is tcp test"
se5 ~]# sendmsg udp "is tcp ss"
logstash主机查看结果
Settings: Default pipeline workers: 2
Pipeline main started
{
"message" => "is tcp test
",
"@version" => "1",
"@timestamp" => "2019-03-01T08:50:39.921Z",
"type" => "udplog",
"host" => "192.168.1.65"
}
{
"message" => "is tcp ss
",
"@version" => "1",
"@timestamp" => "2019-03-01T08:50:55.608Z",
"type" => "udplog",
"host" => "192.168.1.65"
}
6)syslog插件练习
logstash ~]# systemctl list-unit-files | grep syslog
rsyslog.service enabled
syslog.socket static
logstash ~]# vim /etc/logstash/logstash.conf
input{
file {
path => [ "/tmp/a.log", "/var/tmp/b.log" ]
sincedb_path => "/var/lib/logstash/sincedb"
start_position => "beginning"
type => "testlog"
}
tcp {
host => "0.0.0.0"
port => "8888"
type => "tcplog"
}
udp {
host => "0.0.0.0"
port => "9999"
type => "udplog"
}
syslog {
port => "514"
type => "syslog"
}
}
filter{
}
output{
stdout{
codec => "rubydebug"
}
}
logstash]# /opt/logstash/bin/logstash -f /etc/logstash/logstash.conf
开启检测
另一个终端查看是否检测到514
logstash ~]# netstat -antup | grep 514
cp6 0 0 :::514 :::* LISTEN 1278/java
udp6 0 0 :::514 :::* 1278/java
另一台主机上面操作,本地写的日志本地可以查看
se5 ~]# vim /etc/rsyslog.conf
local0.info /var/log/mylog //自己添加这一行
se5 ~]# systemctl restart rsyslog //重启rsyslog
se5 ~]# ll /var/log/mylog //提示没有那个文件或目录
se5 ~]# logger -p local0.info -t nsd "elk" //写日志
se5 ~]# ll /var/log/mylog //再次查看,有文件
-rw------- 1 root root 29 3月 1 17:05 /var/log/mylog
se5 ~]# tail /var/log/mylog //可以查看到写的日志
Mar 1 17:05:02 se5 nsd: elk
se5 ~]# tail /var/log/messages
//可以查看到写的日志,因为配置文件里有写以.info结尾的可以收到
...
Mar 1 17:05:02 se5 nsd: elk
把本地的日志发送给远程1.67
se5 ~]# vim /etc/rsyslog.conf
local0.info @192.168.1.67:514 (添加这行)
//写一个@或两个@@都可以,一个@代表udp,两个@@代表tcp
se5 ~]# systemctl restart rsyslog
se5 ~]# logger -p local0.info -t nds "001 elk"
logstash检测到写的日志
{
"message" => "001 elk",
"@version" => "1",
"@timestamp" => "2019-03-01T09:11:12.000Z",
"type" => "syslog",
"host" => "192.168.1.65",
"priority" => 134,
"timestamp" => "Mar 1 17:11:12",
"logsource" => "se5",
"program" => "nds",
"severity" => 6,
"facility" => 16,
"facility_label" => "local0",
"severity_label" => "Informational"
}
rsyslog.conf配置向远程发送数据,远程登陆1.65的时侯,把登陆日志的信息(/var/log/secure)转发给logstash即1.67这台机器
se5 ~]# vim /etc/rsyslog.conf
57 authpriv.* @@192.168.1.67:514
//57行的/var/log/secure改为@@192.168.1.67:514
se5 ~]# systemctl restart rsyslog
logstash ~]# /opt/logstash/bin/logstash -f /etc/logstash/logstash.conf
//找一台主机登录1.65,logstash主机会有数据
Settings: Default pipeline workers: 2
Pipeline main started
{
"message" => "Accepted publickey for root from 192.168.1.254 port 40954 ssh2: RSA SHA256:+bNE5YtlrU+NbKSDeszQXuk2C8Dc0si6BMbKVybe4Ig
",
"@version" => "1",
"@timestamp" => "2019-03-01T09:15:31.000Z",
"type" => "syslog",
"host" => "192.168.1.65",
"priority" => 86,
"timestamp" => "Mar 1 17:15:31",
"logsource" => "se5",
"program" => "sshd",
"pid" => "968",
"severity" => 6,
"facility" => 10,
"facility_label" => "security/authorization",
"severity_label" => "Informational"
}
{
"message" => "pam_unix(sshd:session): session opened for user root by (uid=0)
",
"@version" => "1",
"@timestamp" => "2019-03-01T09:15:31.000Z",
"type" => "syslog",
"host" => "192.168.1.65",
"priority" => 86,
"timestamp" => "Mar 1 17:15:31",
"logsource" => "se5",
"program" => "sshd",
"pid" => "968",
"severity" => 6,
"facility" => 10,
"facility_label" => "security/authorization",
"severity_label" => "Informational"
}
7)filter grok插件
grok插件:
解析各种非结构化的日志数据插件
grok使用正则表达式把非结构化的数据结构化
在分组匹配,正则表达式需要根据具体数据结构编写
虽然编写困难,但适用性极广
logstash ~]# vim /etc/logstash/logstash.conf
input{
stdin{ codec => "json" }
file {
path => [ "/tmp/a.log", "/var/tmp/b.log" ]
sincedb_path => "/var/lib/logstash/sincedb"
start_position => "beginning"
type => "testlog"
}
tcp {
host => "0.0.0.0"
port => "8888"
type => "tcplog"
}
udp {
host => "0.0.0.0"
port => "9999"
type => "udplog"
}
syslog {
port => "514"
type => "syslog"
}
}
filter{
grok{
match => ["message", "(?<key>reg)"]
}
}
output{
stdout{
codec => "rubydebug"
}
}
logstash ~]# /opt/logstash/bin/logstash -f /etc/logstash/logstash.conf
开启检测
se5 ~]# yum -y install httpd
se5 ~]# systemctl restart httpd
se5 ~]# vim /var/log/httpd/access_log
192.168.1.254 - - [15/Sep/2018:18:25:46 +0800] "GET / HTTP/1.1" 403 4897 "-" "Mozilla/5.0 (Windows NT 6.1; WOW64; rv:52.0) Gecko/20100101 Firefox/52.0"
新开窗口,复制/var/log/httpd/access_log的日志到logstash下的/tmp/a.log
logstash ~]# vim /tmp/a.log
192.168.1.254 - - [15/Sep/2018:18:25:46 +0800] "GET / HTTP/1.1" 403 4897 "-" "Mozilla/5.0 (Windows NT 6.1; WOW64; rv:52.0) Gecko/20100101 Firefox/52.0"
//出现message的日志,但是没有解析是什么意思
{
"message" => ".168.1.254 - - [15/Sep/2018:18:25:46 +0800] "GET / HTTP/1.1" 403 4897 "-" "Mozilla/5.0 (Windows NT 6.1; WOW64; rv:52.0) Gecko/20100101 Firefox/52.0"",
"@version" => "1",
"@timestamp" => "2019-03-01T09:38:24.428Z",
"path" => "/tmp/a.log",
"host" => "logstash",
"type" => "testlog",
"tags" => [
[0] "_grokparsefailure"
]
}
若要解决没有解析的问题,同样的方法把日志复制到/tmp/a.log,logstash.conf配置文件里面修改grok
查找正则宏路径
logstash ~]# cd /opt/logstash/vendor/bundle/
bundle]# vim grok-patterns //查找COMBINEDAPACHELOG
COMBINEDAPACHELOG %{COMMONAPACHELOG} %{QS:referrer} %{QS:agent}
logstash ~]# vim /etc/logstash/logstash.conf
...
filter{
grok{
match => ["message", "%{COMBINEDAPACHELOG}"]
}
}
...
解析出的结果
logstash ~]# /opt/logstash/bin/logstash -f /etc/logstash/logstash.conf
Settings: Default pipeline workers: 2
Pipeline main started
{
"message" => "192.168.1.254 - - [15/Sep/2018:18:25:46 +0800] "GET /noindex/css/open-sans.css HTTP/1.1" 200 5081 "http://192.168.1.65/" "Mozilla/5.0 (Windows NT 6.1; WOW64; rv:52.0) Gecko/20100101 Firefox/52.0"",
"@version" => "1",
"@timestamp" => "2018-09-15T10:55:57.743Z",
"path" => "/tmp/a.log",
"host" => "logstash",
"type" => "testlog",
"clientip" => "192.168.1.254",
"ident" => "-",
"auth" => "-",
"timestamp" => "15/Sep/2018:18:25:46 +0800",
"verb" => "GET",
"request" => "/noindex/css/open-sans.css",
"httpversion" => "1.1",
"response" => "200",
"bytes" => "5081",
"referrer" => ""http://192.168.1.65/"",
"agent" => ""Mozilla/5.0 (Windows NT 6.1; WOW64; rv:52.0) Gecko/20100101 Firefox/52.0""
}
2.2 安装Apache服务,用filebeat收集Apache服务器的日志,存入elasticsearch
1)在之前安装了Apache的主机上面安装filebeat
se5 ~]# yum -y install filebeat
se5 ~]# vim /etc/filebeat/filebeat.yml
paths:
- /var/log/httpd/access_log //日志的路径,短横线加空格代表yml格式
document_type: apachelog //文档类型
elasticsearch: //加上注释
hosts: ["localhost:9200"] //加上注释
logstash: //去掉注释
hosts: ["192.168.1.67:5044"] //去掉注释,logstash那台主机的ip
se5 ~]# systemctl start filebeat
logstash ~]# vim /etc/logstash/logstash.conf
input{
stdin{ codec => "json" }
beats{
port => 5044
}
file {
path => [ "/tmp/a.log", "/var/tmp/b.log" ]
sincedb_path => "/dev/null"
start_position => "beginning"
type => "testlog"
}
tcp {
host => "0.0.0.0"
port => "8888"
type => "tcplog"
}
udp {
host => "0.0.0.0"
port => "9999"
type => "udplog"
}
syslog {
port => "514"
type => "syslog"
}
}
filter{
if [type] == "apachelog"{
grok{
match => ["message", "%{COMBINEDAPACHELOG}"]
}}
}
output{
stdout{ codec => "rubydebug" }
if [type] == "filelog"{
elasticsearch {
hosts => ["192.168.1.61:9200", "192.168.1.62:9200"]
index => "filelog"
flush_size => 2000
idle_flush_time => 10
}}
}
logstash]# /opt/logstash/bin/logstash -f /etc/logstash/logstash.conf
打开另一终端查看5044是否成功启动
logstash ~]# netstat -antup | grep 5044
se5 ~]# firefox 192.168.1.65 //ip为安装filebeat的那台机器
回到原来的终端,有数据
2)修改logstash.conf文件
logstash]# vim /etc/logstash/logstash.conf
...
output{
stdout{ codec => "rubydebug" }
if [type] == "apachelog"{
elasticsearch {
hosts => ["192.168.1.61:9200", "192.168.1.62:9200"]
index => "apachelog"
flush_size => 2000
idle_flush_time => 10
}}
}
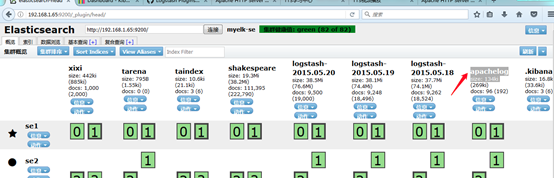
浏览器访问Elasticsearch,有apachelog
##########################
知识点整理:
01:Kibana 数据展示
02:Logstash 数据采集、加工处理即传输的工具
所有类型的数据集中处理
不同模式和模式数据的正常化
自定义日志格式的迅速扩展
为自定义数据源轻松添加插件
input-->filter-->output
03:Logstash配置扩展插件
codec,input file,sincedb_path(日志读取起始位置),syslog(获取系统日志),filter grok 解析各种非结构化的日志数据插件
www.jinbuguo.com(帮助文档汉化)
04:filebeat(c语言编写,安装在每台web服务器上)将web日志发送给logstash(的beats模块)