第十讲内容
• pushgateway 的介绍
• pushgateway 的安装和运⾏和配置
• ⾃定义编写脚本的⽅法 发送pushgateway 采集
• 使⽤pushgateway的优缺点
(⼀) pushgateway 的介绍
pushgateway 是另⼀种采⽤被动推送的⽅式(⽽不是exporter 主动获取)获取监控数据的prometheus 插件 在上篇中 我们对pushgateway已经做过介绍 它是可以单独运⾏在 任何节点上的插件(并不⼀定要在被监 控客户端) 然后 通过⽤户⾃定义开发脚本 把需要监控的数据 发送给 pushgateway 然后pushgateway 再把数据 推送给prometheus server
(⼆)pushgatway 的安装和运⾏和配置
下载地址:https://prometheus.io/download/#pushgateway
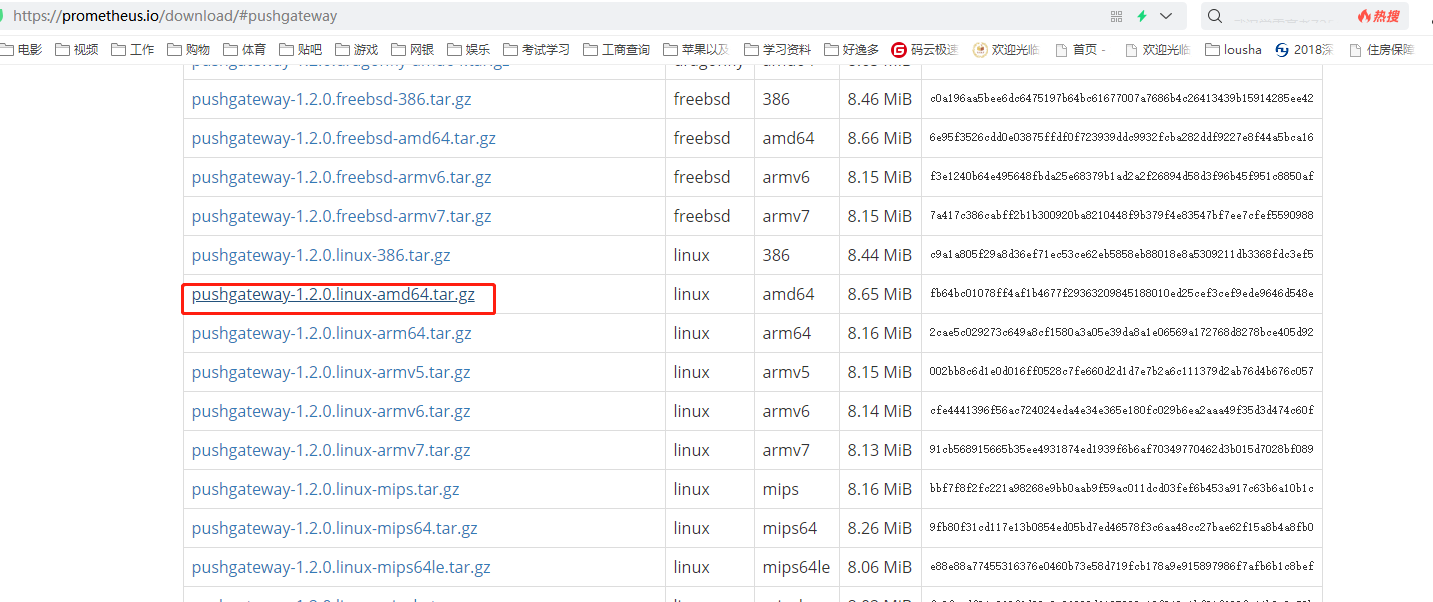
解压设置systemctl运行
cd /usr/local
tar -xf pushgateway-1.2.0.linux-amd64.tar.gz
mv pushgateway-1.2.0.linux-amd64 pushgateway
设置systemctl文件
# cat /usr/lib/systemd/system/pushgateway.service
[Unit]
Description=Prometheus Node Exporter
After=network.target

[Service]
ExecStart=/usr/local/pushgateway/pushgateway
User=nobody

[Install]
WantedBy=multi-user.target
启动
systemctl daemon-reload
systemctl start pushgateway
systemctl enable pushgateway
关于pushgateway的配置 主要指的是 在prometheus sever端的配 置
 job_name: 'pushgateway'
    static_configs:
    - targets: ['192.168.1.101:9091','192.168.1.101:9092']
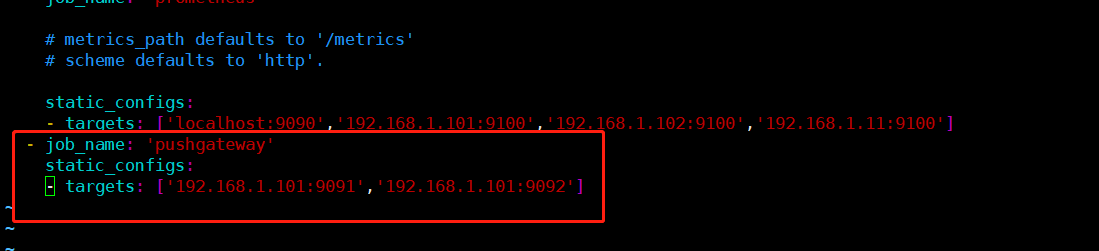
这⾥我们发现了没有, localhost:9091/9092 使⽤的 pushgateway开启了两个
在prometheus_server 本机上 为什么开启两个 最后⼀个段落给⼤家解释
重启prometheus
(三)⾃定义编写脚本的⽅法 发送pushgateway 采集
接下来 进⼊重头戏了 pushgateway 本⾝是没有任何抓取监控数据的功能的 它只是被 动的等待推送过来
# cat /usr/local/node_exporter/node_exporter_shell.sh
#!/bin/bash
instance_name=`hostname -f | cut -d '.' -f1`  #?#本机机器名 变量用于于之后的标签
if [ $instance_name == "localhost" ];then
echo "Must FQDN hostname"
fi

# For waitting connections
label="count_netstat_wait_connections"
count_netstat_wait_connections=`netstat -an | grep -i wait | wc -l`
echo "$label : $count_netstat_wait_connections"
echo "$label $count_netstat_wait_connections"|curl --data-binary @- http://192.168.1.101:9091/metrics/job/pushgateway/instance/$instance_name
脚本解释
#获取主机名用于区分不同主机,而且机器名不能是localhost
instance_name=`hostname -f | cut -d '.' -f1`
#后⾯红⾊部分 是我们通过Linux命令⾏ 就简单的获取到了 我 们需要监控的数据 TCP_WAIT数
count_netstat_wait_connections=`netstat -an | grep -i wait | wc -l`
#最后这⾥ ⽤POST ⽅式 把 key & value 推送给 pushgatway的URL地址
curl --data-binary @- http://192.168.1.101:9091/metrics/job/pushgateway/instance/$instance_name
#url的主location
http://192.168.1.101:9091/metrics/job/pushgateway/
#这⾥是 第⼆部分  第⼀个标签: 推送到 哪⼀个prometheus.yml 定义的 job⾥
job/pushgateway/
#这⾥是 第⼆个标签 推送后 显⽰的 机器名是什么
instance/$instance_name
手动运行该脚本,然后放入crontab运行就可以定时抓取服务器tcp的wait链接信息了
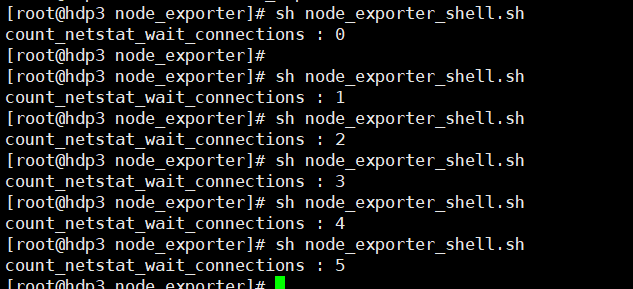
web界面查看
count_netstat_wait_connections

(四)pushgateway的优缺点
pushgateway这种⾃定义的 采集⽅式 ⾮常的快速 ⽽且极其灵活 ⼏乎不收到任何约束 其实我个⼈ 还是⾮常希望 使⽤pushgateway来获取监控数据的 各类的exporters虽然玲琅满⽬ ⽽且默认提供的数据很多了已 经 ⼀般情况下 我在企业中 只安装 node_exporter 和 DB_exporter 两个 其他种类的 监控数据 我倾向于 全部使⽤pushgateway的⽅式 采集
pushgateway的缺点
1) pushgateway 会形成⼀个单点瓶颈,假如好多个 脚本同时 发送给 ⼀个pushgateway的进程 如果这个进程没了,那么监控数据也就没了
2) pushgateway 并不能对发送过来的 脚本采集数据 进⾏更智 能的判断 假如脚本中间采集出问题了 那么有问题的数据 pushgateway⼀样照单全收 发送给 prometheus
作业
我们⾃⼰搭建pushgateway 并⾃⾏编写⼀个 采集脚本 (bash shell即可) 采集⼀个 ping 延迟和丢包率