参考:https://www.cnblogs.com/Dev0ps/p/10778962.html
1.收集那些日志
k8s系统组件日志
k8s部署应用中的日志
2.日志方案
filebeat+ELK
Log file->filebeat->logstash->elasticsearch->kibana
3.容器中的日志怎么收集
方案一:Node上部署一个日志收集程序
DaemonSet方式部署日志收集程序
对node节点的/var/log和/var/lib/docker/containers/两个目录下的日志进行采集
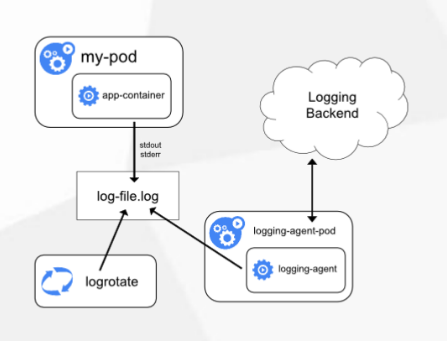
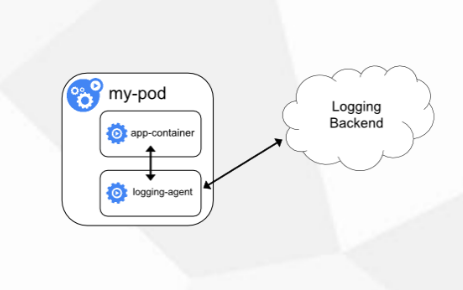
方案二:Pod中附加专用日志收集的容器
每个运行应用程序的Pod中增加一个日志收集容器,使用emptyDir共享日志目录让日志收集程序读取到
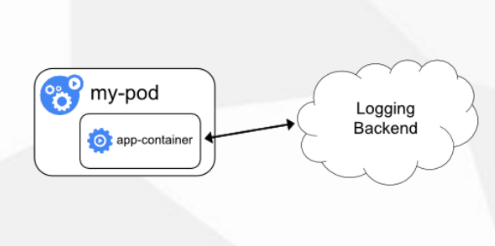
方案三:应用程序直接推送日志
超出Kubernetes范围
| 方式 | 优点 | 缺点 |
| 方案一 |
每个Node仅需不是一个日志收集程序 资源消耗少,对应用无侵入 |
应用程序日志需要写到标准错误输出,不支持多行 日志 |
| 方案二 | 低耦合 |
每个Pod启动一个日志收集代理,增加资源消耗,增加 运维成本 |
| 方案三 | 无需额外部署公交 | 进入应用,增加应用复杂度 |
使用方案二在Pod中启动日志收集代理
在192.168.1.61安装ELK
安装前需要先配置java环境
rpm -ivh elasticsearch-6.6.2.rpm kibana-6.6.2-x86_64.rpm logstash-6.6.2.rpm
elasticsearch配置文件
# grep '^[a-Z]' /etc/elasticsearch/elasticsearch.yml
cluster.name: my-es
node.name: node-1
path.data: /var/lib/elasticsearch
path.logs: /var/log/elasticsearch
network.host: 192.168.1.61
http.port: 9200
kibana配置文件
# grep '^[a-Z]' /etc/kibana/kibana.yml
server.port: 5601
server.host: "0.0.0.0"
elasticsearch.hosts: ["http://192.168.1.61:9200"]
kibana.index: ".kibana"
启动
systemctl start elasticsearch
systemctl start kibana
收集k8s日志
1,添加logstash配置文件
# cat /etc/logstash/conf.d/logstash-to-es.conf
input {
  beats {
     port => 5044
  }
}


filter {
}

output {
      #标签,在filebeat配置文件定义
       if [app] == "k8s" {
        if [type] == "module" {
           elasticsearch {
              hosts => ["http://192.168.1.61:9200"]
              index => "k8s-log-%{+YYYY.MM.dd}"
           }
        }
    }
}
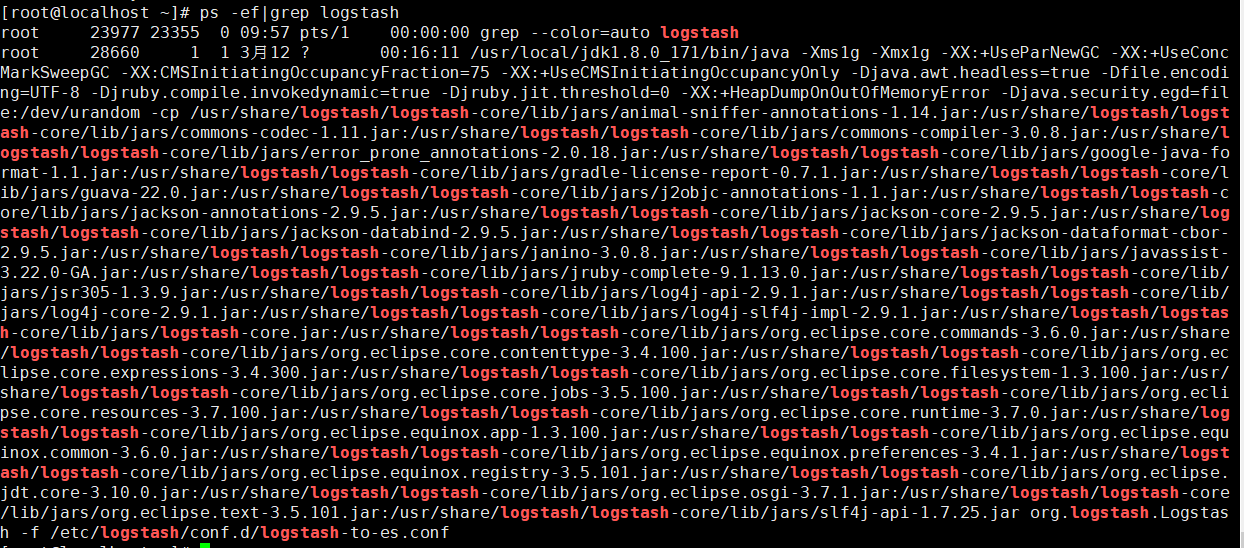
2,启动logstash
/usr/share/logstash/bin/logstash -f /etc/logstash/conf.d/logstash-to-es.conf &
3,创建filebeat的yaml文件
# cat k8s-logs.yaml
apiVersion: v1
kind: ConfigMap
metadata:
  name: k8s-logs-filebeat-config
  namespace: kube-system

data:
  filebeat.yml: |-
    filebeat.prospectors:
      - type: log
        #挂载日志的目录
        paths:
          - /messages
        #定义日志标签
        fields:
          app: k8s
          type: module
        fields_under_root: true
    #设置输出到logstash
    output.logstash:
      hosts: ['192.168.1.61:5044']

---

apiVersion: apps/v1
kind: DaemonSet
metadata:
  name: k8s-logs
  namespace: kube-system
spec:
  selector:
    matchLabels:
      project: k8s
      app: filebeat
  template:
    metadata:
      labels:
        project: k8s
        app: filebeat
    spec:
      containers:
      - name: filebeat
        #官方镜像版本号需要与ELK版本号对应
        image: docker.elastic.co/beats/filebeat:6.6.2
        args: [
          "-c", "/etc/filebeat.yml",
          "-e",
        ]
        resources:
          requests:
            cpu: 100m
            memory: 100Mi
          limits:
            cpu: 500m
            memory: 500Mi
        securityContext:
          runAsUser: 0
        volumeMounts:
        - name: filebeat-config
          mountPath: /etc/filebeat.yml
          subPath: filebeat.yml
        - name: k8s-logs
          mountPath: /messages
      volumes:
      - name: k8s-logs
        #收集日志为node对应的日志目录
        hostPath:
          path: /var/log/messages
          type: File
      - name: filebeat-config
        configMap:
          name: k8s-logs-filebeat-config
4,创建Pod
# kubectl apply -f k8s-logs.yaml
configmap/k8s-logs-filebeat-config created
daemonset.apps/k8s-logs created
查看,因为部署方式采取的是DaemonSet所以在每个node上都会启动对应Pod来收集日志
# kubectl get pod -n kube-system -o wide
NAME                       READY   STATUS    RESTARTS   AGE     IP            NODE           NOMINATED NODE   READINESS GATES
coredns-65589b968c-5b7xv   1/1     Running   2          3d16h   172.17.45.3   192.168.1.66   <none>           <none>
k8s-logs-gwrgk             1/1     Running   0          37s     172.17.45.5   192.168.1.66   <none>           <none>
k8s-logs-s5s9k             1/1     Running   0          37s     172.17.9.5    192.168.1.65   <none>           <none>
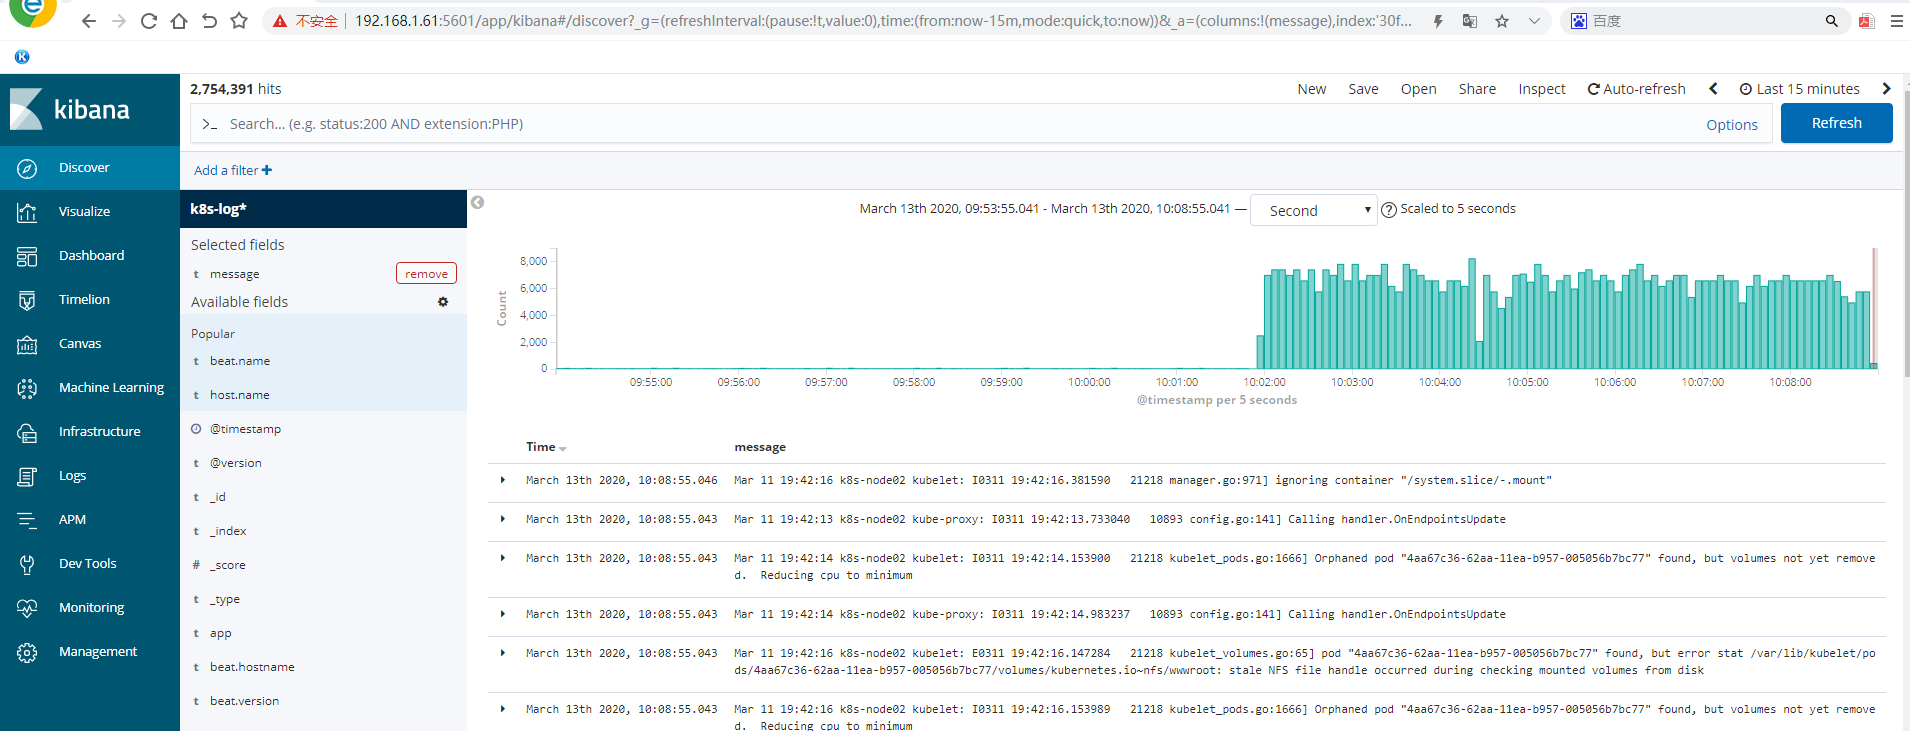
,5,kibana添加索引
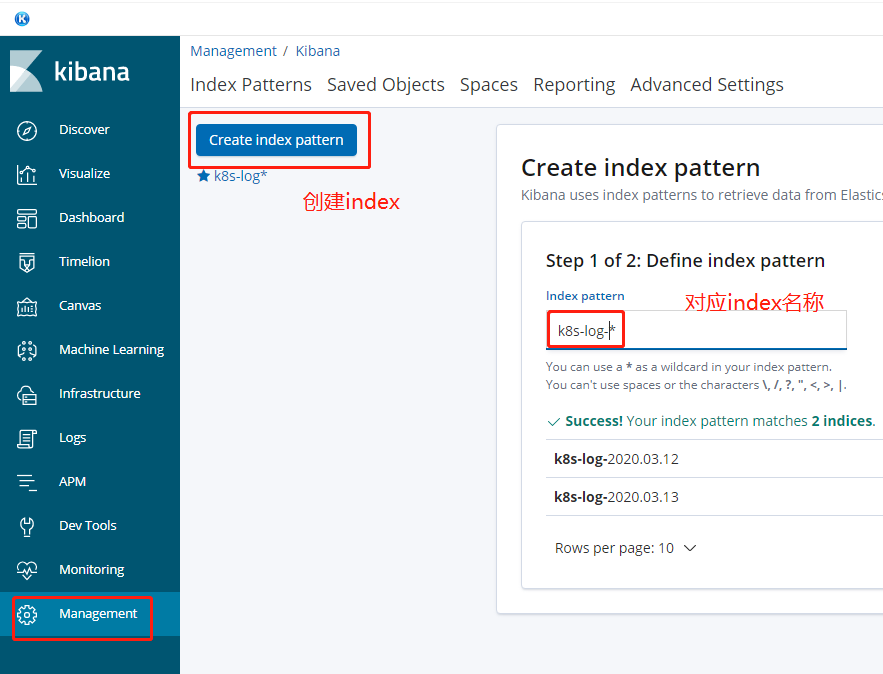
实际收集的是每个node的/var/log/message日志 挂载在容器的/message
登录Pod对应的容器查看
kubectl exec -it k8s-logs-gwrgk bash
#查看filebeat版本
# filebeat -version
Flag --version has been deprecated, use version subcommand
filebeat version 6.6.2 (amd64), libbeat 6.6.2
#filebeat进程
[root@k8s-logs-gwrgk filebeat]# ps -ef|grep filebeat
root         1     0 11 02:01 ?        00:01:11 filebeat -c /etc/filebeat.yml -e
root        47    16  0 02:12 pts/0    00:00:00 grep --color=auto filebeat
#filebe配置文件对应刚刚yaml配置文件
[root@k8s-logs-gwrgk filebeat]# cat /etc/filebeat.yml
filebeat.prospectors:
  - type: log
    #挂载日志的目录
    paths:
      - /messages
    #定义日志标签
    fields:
      app: k8s
      type: module
    fields_under_root: true
#设置输出到logstash
output.logstash:
  hosts: ['192.168.1.61:5044']
收集nginx日志
1,创建nginx-deployment
默认日志路径为:/var/log/nginx
# cat nginx-deployment.yaml
apiVersion: apps/v1beta1
kind: Deployment
metadata:
  name: nginx-demo
#  namespace: test
spec:
  replicas: 3
  selector:
    matchLabels:
      project: www
      app: www
  template:
    metadata:
      labels:
        project: www
        app: www
    spec:
      imagePullSecrets:
      - name: registry-pull-secret
      containers:
      - name: nginx
        image: nginx:latest
        imagePullPolicy: Always
        ports:
        - containerPort: 80
          name: web
          protocol: TCP
        resources:
          requests:
            cpu: 0.5
            memory: 256Mi
          limits:
            cpu: 1
            memory: 1Gi
        resources:
          requests:
            cpu: 0.5
            memory: 256Mi
          limits:
            cpu: 1
            memory: 1Gi
        livenessProbe:
          httpGet:
            path: /index.html
            port: 80
          initialDelaySeconds: 6
          timeoutSeconds: 20
        volumeMounts:
        - name: nginx-logs
          mountPath: /var/log/nginx/

      - name: filebeat
        image: docker.elastic.co/beats/filebeat:6.6.2
        args: [
          "-c", "/etc/filebeat.yml",
          "-e",
        ]
        resources:
          limits:
            memory: 500Mi
          requests:
            cpu: 100m
            memory: 100Mi
        securityContext:
          runAsUser: 0
        volumeMounts:
        - name: filebeat-config
          mountPath: /etc/filebeat.yml
          subPath: filebeat.yml
        - name: nginx-logs
          mountPath: /var/log/nginx/

      volumes:
      - name: nginx-logs
        emptyDir: {}
      - name: filebeat-config
        configMap:
          name: filebeat-nginx-config
创建filebeat配置文件收集日志
# cat filebeat-nginx-configmap.yaml
apiVersion: v1
kind: ConfigMap
metadata:
  name: filebeat-nginx-config
#  namespace: test

data:
  filebeat.yml: |-
    filebeat.prospectors:
      - type: log
        paths:
          - /var/log/nginx/access.log
        # tags: ["access"]
        fields:
          app: www
          type: nginx-access
        fields_under_root: true

      - type: log
        paths:
          - /var/log/nginx/error.log
        # tags: ["error"]
        fields:
          app: www
          type: nginx-error
        #层级放到顶级
        fields_under_root: true

    output.logstash:
      hosts: ['192.168.1.61:5044']
应用
kubectl apply -f nginx-deployment.yaml
kubectl apply -f filebeat-nginx-configmap.yaml
修改logstash配置文件
# cat /etc/logstash/conf.d/logstash-to-es.conf
input {
  beats {
     port => 5044
  }
}


filter {
}

output {
    if [app] == "www" {
        if [type] == "nginx-access" {
           elasticsearch {
              hosts => ["http://192.168.1.61:9200"]
              index => "nginx-access-%{+YYYY.MM.dd}"
           }
        }
        else if [type] == "nginx-error" {
           elasticsearch {
              hosts => ["http://192.168.1.61:9200"]
              index => "nginx-error-%{+YYYY.MM.dd}"
           }
        }
    }
        else if [app] == "k8s" {
          if [type] == "module" {
           elasticsearch {
              hosts => ["http://192.168.1.61:9200"]
              index => "k8s-log-%{+YYYY.MM.dd}"
           }
        }
    }
#  stdout { codec=> rubydebug }
}
启动logstash
/usr/share/logstash/bin/logstash -f /etc/logstash/conf.d/logstash-to-es.conf &
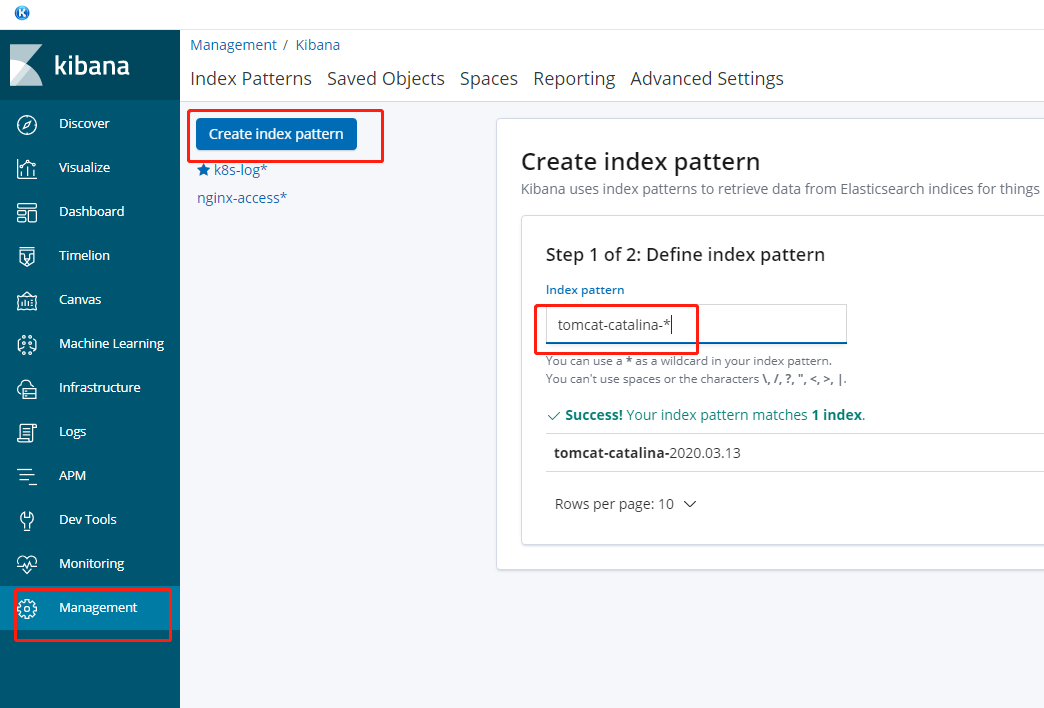
kibana添加索引
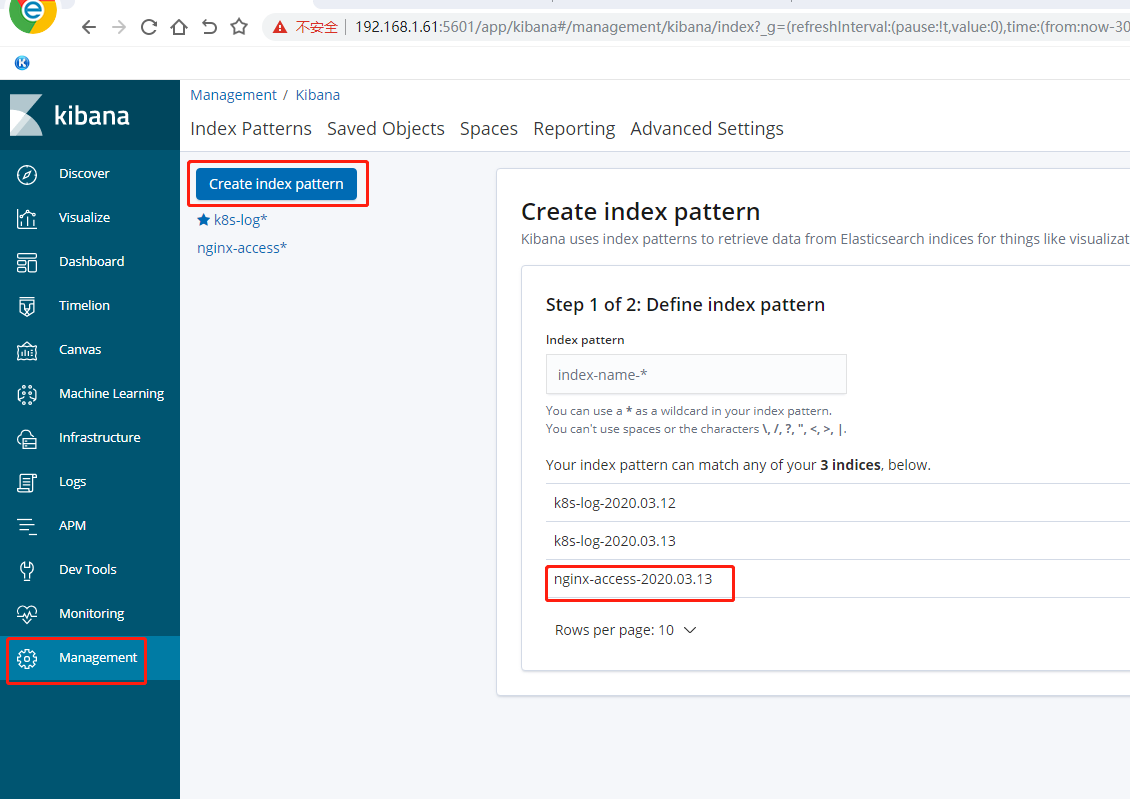
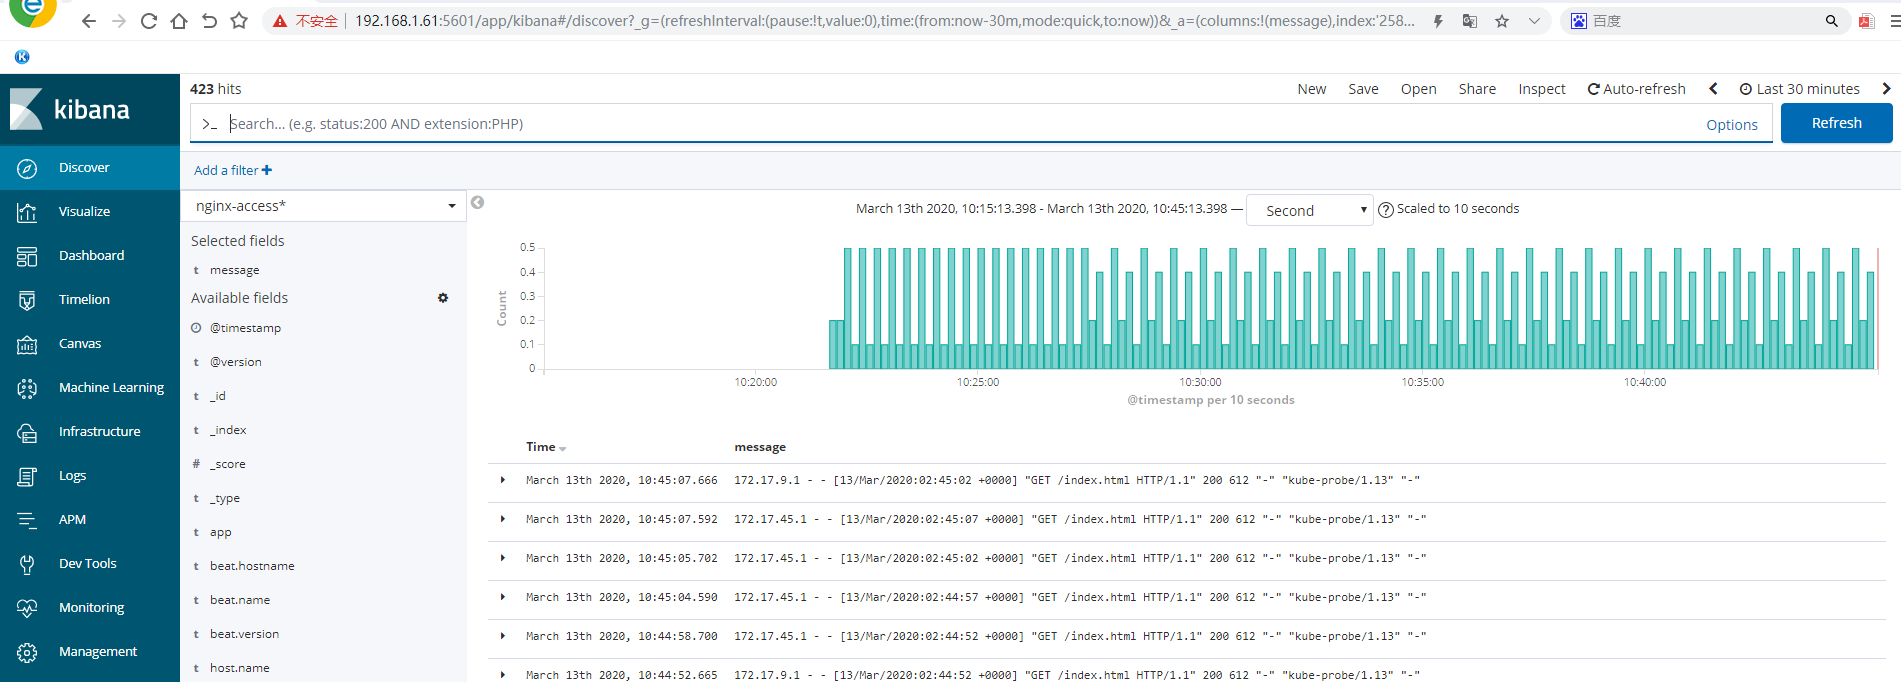
收集的日志是nginx容器内日志,可以登录容器查看
kubectl exec -it nginx-demo-6c6b6f7f7-4mnl8 bash
没有访问日志也有健康检查的日志
tail -f /var/log/nginx/access.log
收集Tomcat日志
1,创建tomcat-deployment
默认日志路径为:/usr/local/tomcat/logs
# cat tomcat-deployment.yaml
apiVersion: apps/v1beta1
kind: Deployment
metadata:
  name: tomcat-java-demo
#  namespace: test
spec:
  replicas: 3
  selector:
    matchLabels:
      project: www
      app: www
  template:
    metadata:
      labels:
        project: www
        app: www
    spec:
      imagePullSecrets:
      - name: registry-pull-secret
      containers:
      - name: tomcat
        image: tomcat:latest
        imagePullPolicy: Always
        ports:
        - containerPort: 8080
          name: web
          protocol: TCP
        resources:
          requests:
            cpu: 0.5
            memory: 1Gi
          limits:
            cpu: 1
            memory: 2Gi
        livenessProbe:
          httpGet:
            path: /
            port: 8080
          initialDelaySeconds: 60
          timeoutSeconds: 20
        readinessProbe:
          httpGet:
            path: /
            port: 8080
          initialDelaySeconds: 60
          timeoutSeconds: 20
        volumeMounts:
        - name: tomcat-logs
          mountPath: /usr/local/tomcat/logs

      - name: filebeat
        image: docker.elastic.co/beats/filebeat:6.6.2
        args: [
          "-c", "/etc/filebeat.yml",
          "-e",
        ]
        resources:
          limits:
            memory: 500Mi
          requests:
            cpu: 100m
            memory: 100Mi
        securityContext:
          runAsUser: 0
        volumeMounts:
        - name: filebeat-config
          mountPath: /etc/filebeat.yml
          subPath: filebeat.yml
        - name: tomcat-logs
          mountPath: /usr/local/tomcat/logs
      volumes:
      - name: tomcat-logs
        emptyDir: {}
      - name: filebeat-config
        configMap:
          name: filebeat-config
2,创建filebeat文件
# cat filebeat-tomcat-configmap.yaml
apiVersion: v1
kind: ConfigMap
metadata:
  name: filebeat-config
#  namespace: test

data:
  filebeat.yml: |-
    filebeat.prospectors:
    - type: log
      paths:
        - /usr/local/tomcat/logs/catalina.*
      # tags: ["tomcat"]
      fields:
        app: www
        type: tomcat-catalina
      fields_under_root: true
      multiline:
        pattern: '^['
        negate: true
        match: after
    output.logstash:
      hosts: ['192.168.1.61:5044']
应用
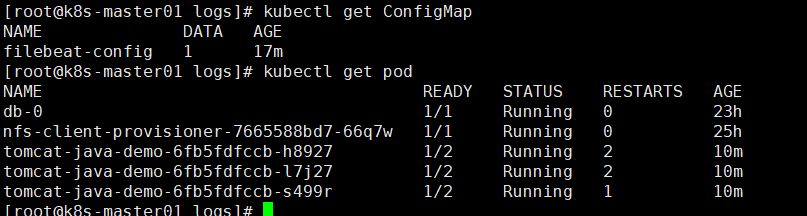
kubectl apply -f tomcat-deployment.yaml
kubectl apply -f filebeat-tomcat-configmap.yaml
查看
3.修改logstash配置文件
# cat /etc/logstash/conf.d/logstash-to-es.conf
input {
  beats {
     port => 5044
  }
}


filter {
}

output {
    if [app] == "www" {
        if [type] == "nginx-access" {
           elasticsearch {
              hosts => ["http://192.168.1.61:9200"]
              index => "nginx-access-%{+YYYY.MM.dd}"
           }
        }
        else if [type] == "nginx-error" {
           elasticsearch {
              hosts => ["http://192.168.1.61:9200"]
              index => "nginx-error-%{+YYYY.MM.dd}"
           }
        }
        else if [type] == "tomcat-catalina" {
           elasticsearch {
              hosts => ["http://192.168.1.61:9200"]
              index => "tomcat-catalina-%{+YYYY.MM.dd}"
           }
        }
    }
        else if [app] == "k8s" {
          if [type] == "module" {
           elasticsearch {
              hosts => ["http://192.168.1.61:9200"]
              index => "k8s-log-%{+YYYY.MM.dd}"
           }
        }
    }
#  stdout { codec=> rubydebug }
}
启动logstash
/usr/share/logstash/bin/logstash -f /etc/logstash/conf.d/logstash-to-es.conf &
kibana添加index