软件开发过程中,项目上线并不是终点。上线后,还要对程序的取样分析运行情况,并重构现有的功能,让程序执行更高效更稳写。 golang的工具包内自带pprof功能,使找出程序中占内存和CPU较多的部分功能方便了不少。加上uber的火焰图,可视化显示,让我们在分析程序时更简单明了。pprof有两个包用来分析程序一个是net/http/pprof另一个是runtime/pprof,net/http/pprof只是对runtime/pprof包进行封装并用http暴露出来,如下图源码所示:
使用net/http/pprof分析web服务
pprof分析web项目,非常的简单只需要导入包即可。 _ "net/http/pprof" 编写一个小的web服务器
package main

import (
    "fmt"
    "math/rand"
    "net/http"
    _ "net/http/pprof"
    "time"
)

var Count int64 = 0

func main() {
    go calCount()

    http.HandleFunc("/test", test)
    http.HandleFunc("/data", handlerData)

    err := http.ListenAndServe(":9909", nil)
    if err != nil {
        panic(err)
    }
}

func handlerData(w http.ResponseWriter, r *http.Request) {
    qUrl := r.URL
    fmt.Println(qUrl)
    fibRev := Fib()
    var fib uint64
    for i := 0; i < 5000; i++ {
        fib = fibRev()
        fmt.Println("fib = ", fib)
    }
    str := RandomStr(RandomInt(100, 500))
    str = fmt.Sprintf("Fib = %d; String = %s", fib, str)
    w.Write([]byte(str))
}

func test(w http.ResponseWriter, r *http.Request) {
    fibRev := Fib()
    var fib uint64
    index := Count
    arr := make([]uint64, index)
    var i int64
    for ; i < index; i++ {
        fib = fibRev()
        arr[i] = fib
        fmt.Println("fib = ", fib)
    }
    time.Sleep(time.Millisecond * 500)
    str := fmt.Sprintf("Fib = %v", arr)
    w.Write([]byte(str))
}

func Fib() func() uint64 {
    var x, y uint64 = 0, 1
    return func() uint64 {
        x, y = y, x+y
        return x
    }
}

var letterRunes = []rune("abcdefghijklmnopqrstuvwxyzABCDEFGHIJKLMNOPQRSTUVWXYZ1234567890")

func RandomStr(num int) string {
    seed := time.Now().UnixNano()
    if seed <= 0 {
        seed = time.Now().UnixNano()
    }
    rand.Seed(seed)
    b := make([]rune, num)
    for i := range b {
        b[i] = letterRunes[rand.Intn(len(letterRunes))]
    }
    return string(b)
}

func RandomInt(min, max int) int {
    rand.Seed(time.Now().UnixNano())
    return rand.Intn(max-min+1) + min
}

func calCount() {
    timeInterval := time.Tick(time.Second)

    for {
        select {
        case i := <-timeInterval:
            Count = int64(i.Second())
        }
    }
}
web服务监听9909端口,web服务器有两个http方法: test: 根据当前的秒数做斐波那契计算; data: 做一个5000的斐波那契计算并返回一个随机的字符串 运行程序,通过访问 http://localhost:9909/debug/pprof/ 可以查看web版的profiles相关信息
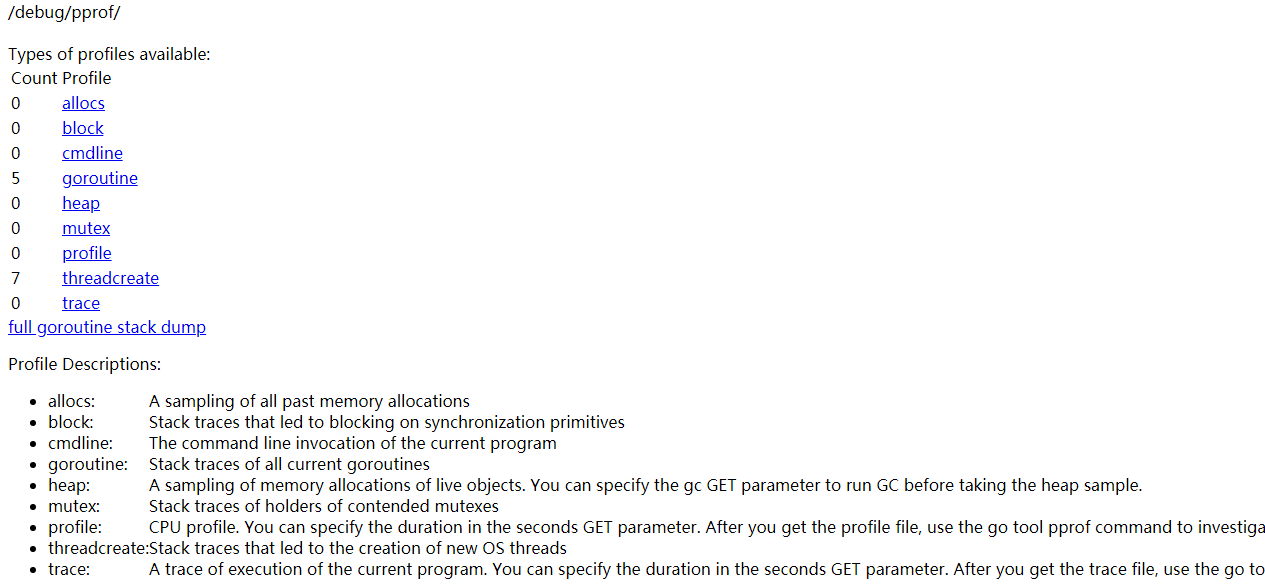
这几个路径表示的是
/debug/pprof/profile:访问这个链接会自动进行 CPU profiling,持续 30s,并生成一个文件供下载
/debug/pprof/block:Goroutine阻塞事件的记录。默认每发生一次阻塞事件时取样一次。
/debug/pprof/goroutines:活跃Goroutine的信息的记录。仅在获取时取样一次。
/debug/pprof/heap: 堆内存分配情况的记录。默认每分配512K字节时取样一次。
/debug/pprof/mutex: 查看争用互斥锁的持有者。
/debug/pprof/threadcreate: 系统线程创建情况的记录。 仅在获取时取样一次。
分析CPU使用情况
使用命令分析CPU使用情况 go tool pprof httpdemo http://localhost:9909/debug/pprof/profile 在默认情况下,Go语言的运行时系统会以100 Hz的的频率对CPU使用情况进行取样。也就是说每秒取样100次,即每10毫秒会取样一次。为什么使用这个频率呢?因为100 Hz既足够产生有用的数据,又不至于让系统产生停顿。并且100这个数上也很容易做换算,比如把总取样计数换算为每秒的取样数。实际上,这里所说的对CPU使用情况的取样就是对当前的Goroutine的堆栈上的程序计数器的取样。
默认的取样时间是30s 你可以通过-seconds 命令来指定取样时间 。取样完成后会进入命令行状态:

可以输入help查看相关的命令.这里说几个常用的命令
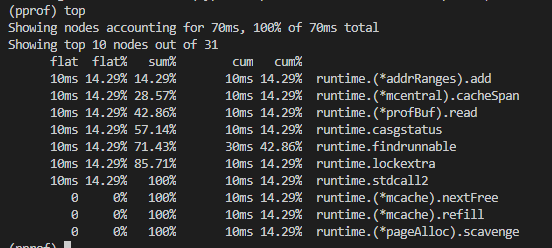
top命令,输入top命令默认是返加前10的占用cpu的方法。当然人可以在命令后面加数字指定top数
list命令根据你的正则输出相关的方法.直接跟可选项o 会输出所有的方法。也可以指定方法名
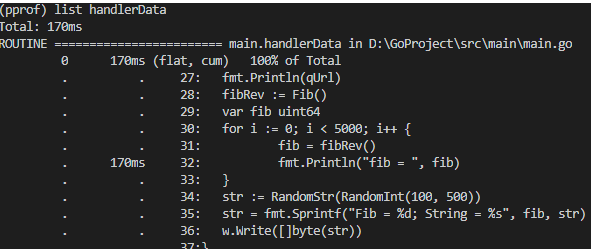
如: handlerData方法占cpu的100%
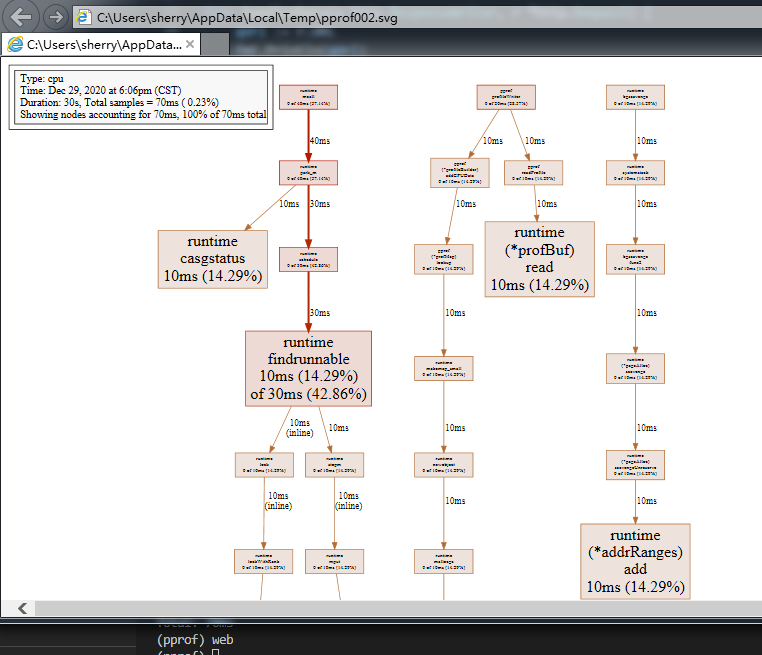
web命令:以网页的形式展现:更直观的显示cpu的使用情况【windows 下需要下载Graphviz ,下载后需要配置环境变量path ,不认会提示错误】
分析内存使用情况
和分析cpu差不多使用命令 go tool pprof httpdemo http://localhost:9909/debug/pprof/heap
默认情况下取样时只取当前内存使用情况,可以加可选命令alloc_objects,将从程序开始时的内存取样 go tool pprof -alloc_objects httpdemo http://localhost:9909/debug/pprof/heap
和cpu的命令一样,top list web。不同的是这里显示的是内存使用情况而已。这里我就不演示了。

安装go-torch
还有更方便的工具就是uber的 go-torch了 安装很简单
-
go get github.com/uber/go-torch
-
cd $GOPATH/src/github.com/uber/go-torch
-
git clone https://github.com/brendangregg/FlameGraph.git
然后运行FlameGraph下的 拷贝 flamegraph.pl 到 /usr/local/bin
火焰图分析CPU
使用命令 go-torch -u http://localhost:9909 --seconds 60 -f cpu.svg
在windows 下会提示: [0mFailed: could not generate flame graph: fork/exec D:GoProjectsrcFlameGraphflamegraph.pl: %1 is not a valid Win32 application. 解决办法如下:
先下载perl https://www.activestate.com/products/perl/downloads/ 或者 https://pan.baidu.com/s/107UTzX-9_vgFPTW93Ec3AA【需要确保添加了环境变量, 可以通过 perl -v 查看版本,安装路径中不要有空格 比如Program Files 中有空格也是有问题的 】
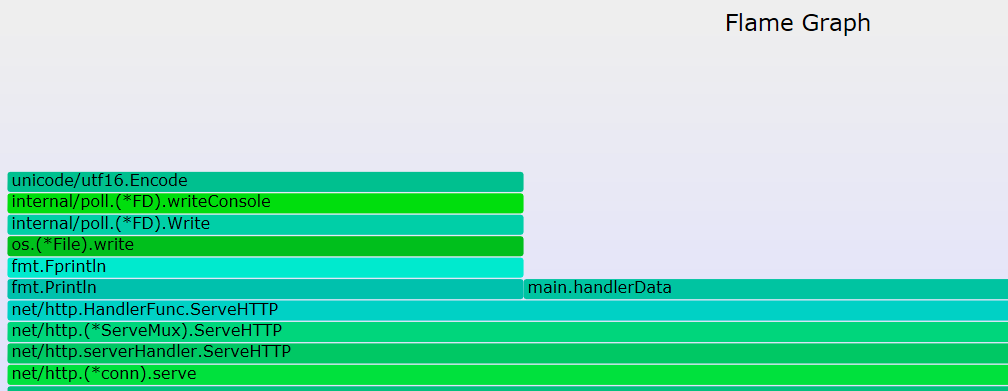
会在当前目录下生成cpu.svg文件,使用浏览器打开


更直观的看到应用程序的问题。handlerData方法占用的cpu时间过长。然后就是去代码里分析并优化了。
火焰图分析内存
使用命令
go-torch http://localhost:9909/debug/pprof/heap --colors mem -f mem.svg会在当前目录下生成cpu.svg文件,使用浏览器打开
参考: