Marcus Mönnig是一名居住在德国汉堡的Oracle Database顾问及DBA,他开发了一款基于Windows平台的面向Oracle DBA和Consultant的图形化工具-Membai,该软件侧重于性能分析。
Membai在现有的Windows主流操作系统包括XP、2003和win7上都可以流畅工作。唯一的先决条件是需要预装Full Oracle Client客户端软件。Membai所支持的Oracle数据库版本包括从9.2到最新的11.2,因为主要是在10.2上测试,所以部分功能可能在9.2中无法正常工作。
Membai的特性包括:
- Instant access to important database views vital for DBAs and consultants
- Retrieved data in Mumbai can be slices and dices in various ways (sorting, filtering, grouping, group arithmetic, etc.)
- Visualization of data in graphs
- SQL console window inducing support for bind variables
- Executions plans for SQL statements from cursor cache, through EXPLAIN PLAN or through DBMS_XPLAN from the Mumbai SQL console window
- Retrieve alert.log and trace files from the database server to Mumbai and process/analyze them there.
- Start and stop 10046 traces for any session or process and trace the statements from your SQL console session with just a few clicks
- Powerful 10046 trace file viewer if you need to dig into the details of a TKPROF or OraSRP report. OraSRP reports can be generated from within Mumbai.
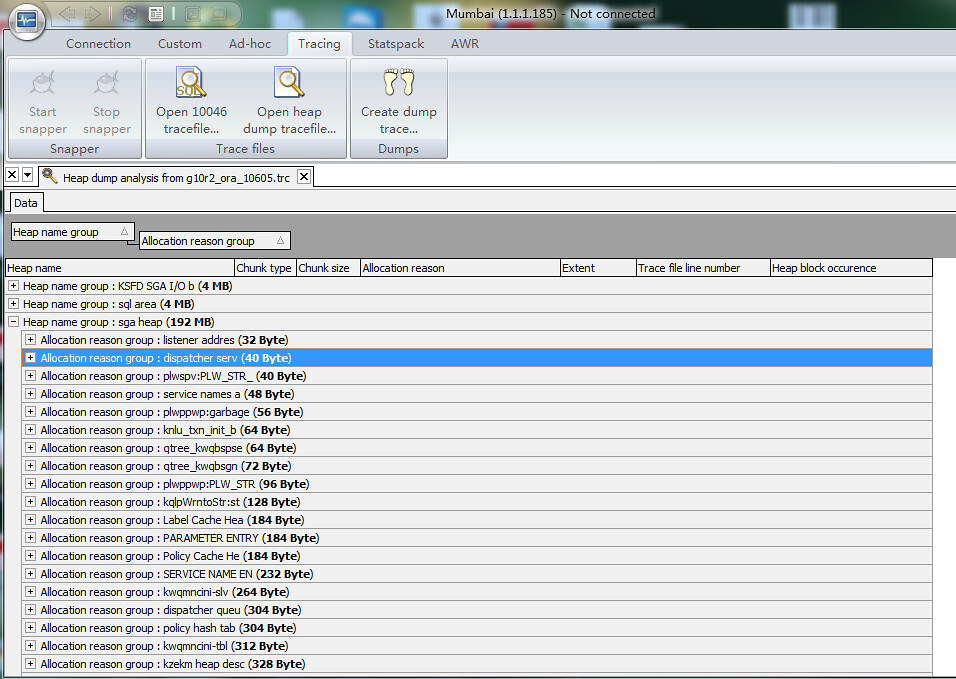
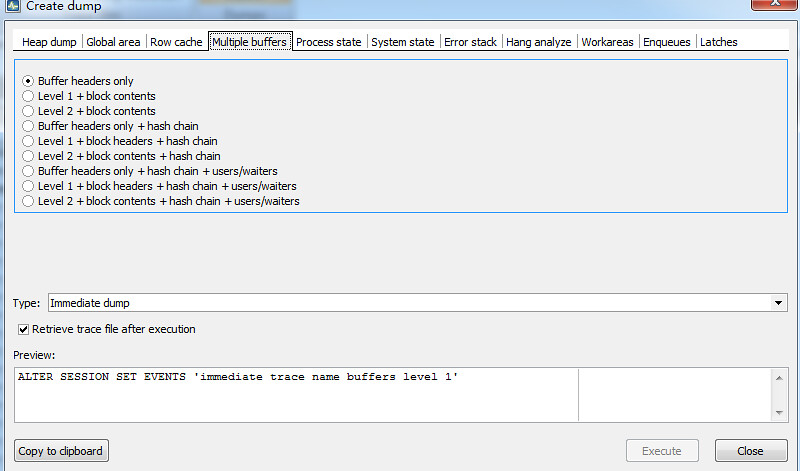
- Heap dump analyzer that aggregates data from trace files
- Instant connections to DB server with RDP, putty or WinSCP
- Run snapper from within Mumbai and let Mumbai visualize the data collected by snapper
- Analyze Statspack or AWR data, e.g. to find interesting intervals for further analysis
值得一提的是Membai提供了heapdump analyze的功能,这对于经常和heapdump打交道的Oracle Consultant来说是一个福音,此外它同时还提供create dump trace的功能,该功能基本涵盖了主要的Oracle转储和诊断事件,有了它我们无需在忘记dump/trace语句时再去翻手册了。其heapdump analyze和create dump trace功能见下图:
Membai最新的版本是1.1.1.185 (released 17 Apr. 2011):
Download here