第一步:下载 echarts 5
npm install echarts --save
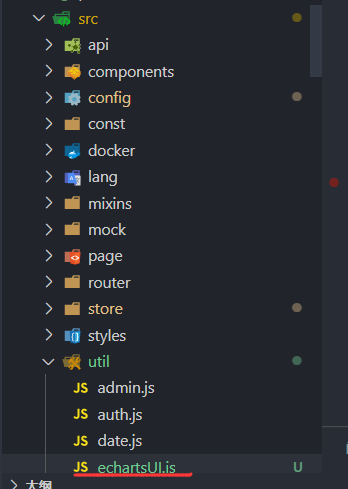
第二步:在util文件夹下,新建了一个echartsUi.js文件 (这个文件存放位置,依据自己需求)
第三步:在这个js文件中,按照官方介绍,按需引用
// 引入 echarts 核心模块,核心模块提供了 echarts 使用必须要的接口。
import * as echarts from "echarts/core";
// 引入各种图表,图表后缀都为 Chart
import { BarChart, PieChart } from "echarts/charts";  //这里我引用两个类型的图表
// 引入提示框,标题,直角坐标系等组件,组件后缀都为 Component
import {
  TitleComponent,
  TooltipComponent,
  GridComponent,
  LegendComponent,
  // GeoCoComponent
} from "echarts/components";
// 引入 Canvas 渲染器,注意引入 CanvasRenderer 或者 SVGRenderer 是必须的一步
import { CanvasRenderer } from "echarts/renderers";

// 注册必须的组件
echarts.use([
  TitleComponent,
  TooltipComponent,
  GridComponent,
  LegendComponent,
  BarChart,
  PieChart,
  CanvasRenderer,
]);

export default echarts;
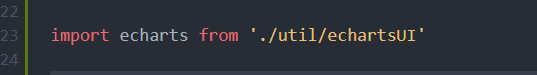
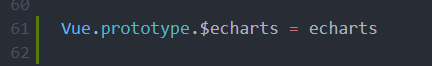
第四步:在main.js文件中引入echats.并注册使用
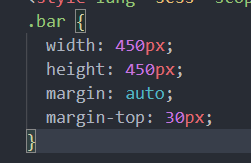
第五步:在页面定义一个div,注册ref = bar,必须要设置具体的宽高

第六步:测试
methods:{
initEcharts () {
  let myEcharts = this.$echarts.init(this.$refs.bar)
  let option = {
    title: {
      text: '按需引入'
    },
    tooltip: {
      trigger: 'axis',
      axisPointer: {
        type: 'shadow'
      }
    },
    xAxis: {
      type: 'category',
      data: ['周一', '周二', '周三', '周四', '周五']
    },
    yAxis: {
      type: 'value'
    },
    legend: {},
    series: [
      {
        name: '星期',
        type: 'bar',
        data: [23, 33, 45, 56, 78]
      }
    ]
  }
  myEcharts.setOption(option)
}
},

在mouted钩子中调用
mounted() {
this.initEcharts ()
},
第七步:效果