| 项目 | 内容 |
|---|---|
| 作业属于哪个课程 | 2020春季计算机学院软件工程 |
| 作业的要求 | 结对项目 |
| 课程的目标 | 实现一个能求解简单几何形状之间交点的软件。 |
软件工程结对作业
接口相关
Information Hiding:
在这次作业中我主要负责core模块,在这里我运用了一些oo的思想,将各种几何体分别写成了类并提供了可能用到的方法,使得前端的同学能够调用类。我希望能够将计算部分全部放在core模块,前端同学只需要调用已经计算好的值即可。
在这一部分我发现了一些可改进的部分,利用dll的对内和对外调用的约束可以更大程度上避免前端调用。
Interface Design:
我们认为,在前端,需要做到:
- 读文件画图
- 增加几何体
- 删除几何体
所以我认为core大概有这几类函数:
- 计算几何体交点
- 加入几何体
- 删除几何体
- 交互函数
对于前端同学,前三类函数是完全不会被直接调用的,只需要调用最后的交互函数,包括:
- Add函数
- Delete函数
- read_file函数
这三者均只传入一个string函数,对于前两个函数这个string表示相应的几何体的构造信息,与输入文件中的几何体信息是一致的,read_file函数则是读入文件名,这就是我们的接口,这三者就足以完成所有的交互,并且这样的接口设计中,传递string规格与文件中几何体信息一致,能够方便我进行一些函数的复用。
Loose Coupling:
我们本次作业采用了前后端分离的模式,后端负责计算数据(core),前端负责展示(画图)。
在最开始,我们没有注意到dll的要求,这使得我们在后续修改时出现了一些麻烦,也对于一些设计有所欠缺。
对于松散耦合,我认为我们的优点在于尽量避免了前端同学过多调用core中的函数。缺点在于,我们用了几个容器来存储几何体的计算结果,这一定程度上破坏了我们的耦合性,或许使用参数传递的方法会更好。
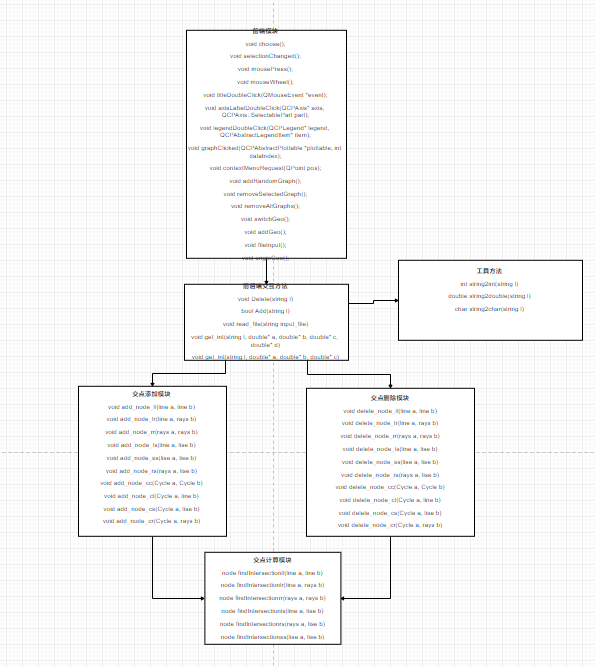
计算模块
本次作业一共使用了6个类,其中1个类为UI类,剩下5个类为图形类,分别为点、直线、射线、线段、圆。
函数一共分为5大类,函数的交互方法如下图(箭头为调用关系):
算法关键:
我们算法的关键在于,计算交点的方法时间复杂度为O(n^2),利用map并重载运算符保证点的唯一性,最后使用前后端分离的方法,前端接受请求,后端处理请求并返回给前端相应数据最终实现需求。
在进行dll封装时,通过是由一些关键字来限制前端调用,对于这些机制我还只是了解,并不太懂其细节。
UML相关
实体关系:
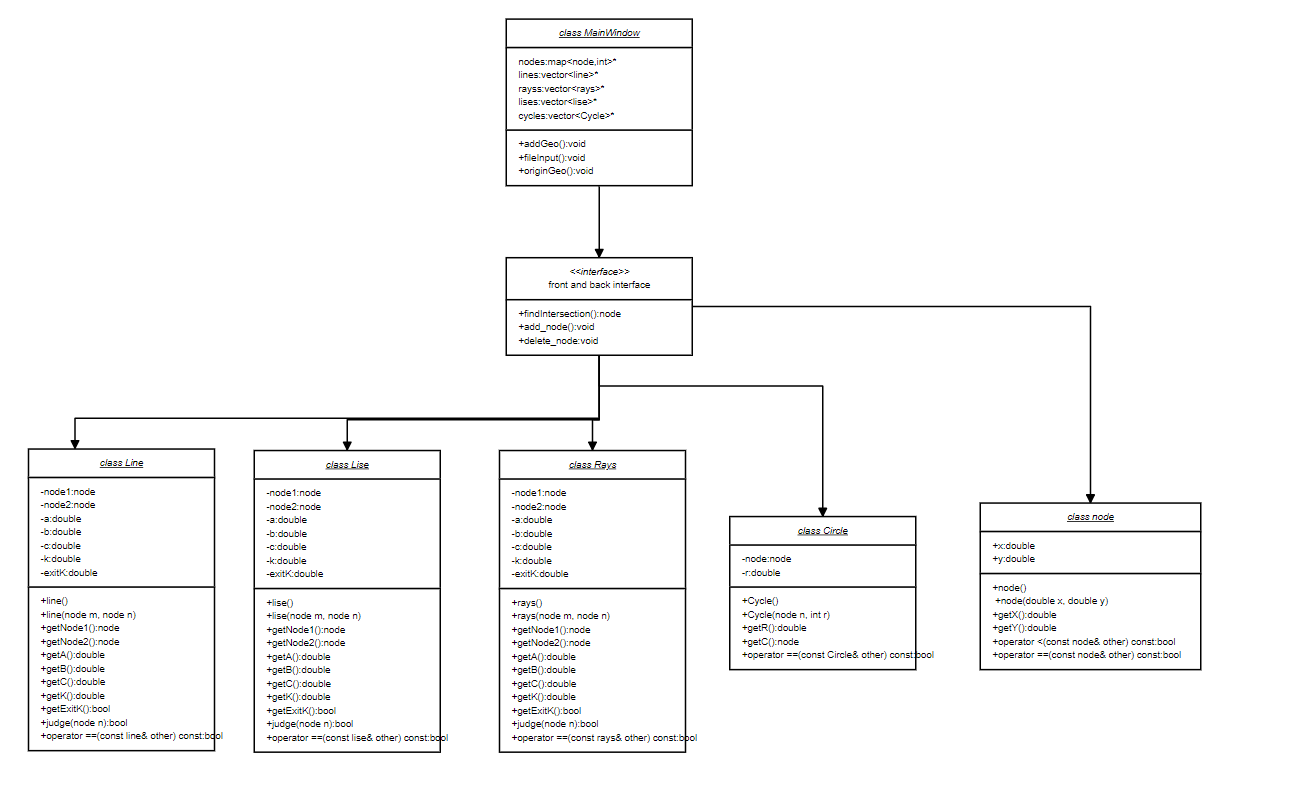
其中带有箭头之间的实体代表具有交互,如图所示,前端想要获取后端数据必须通过后端提供的接口。
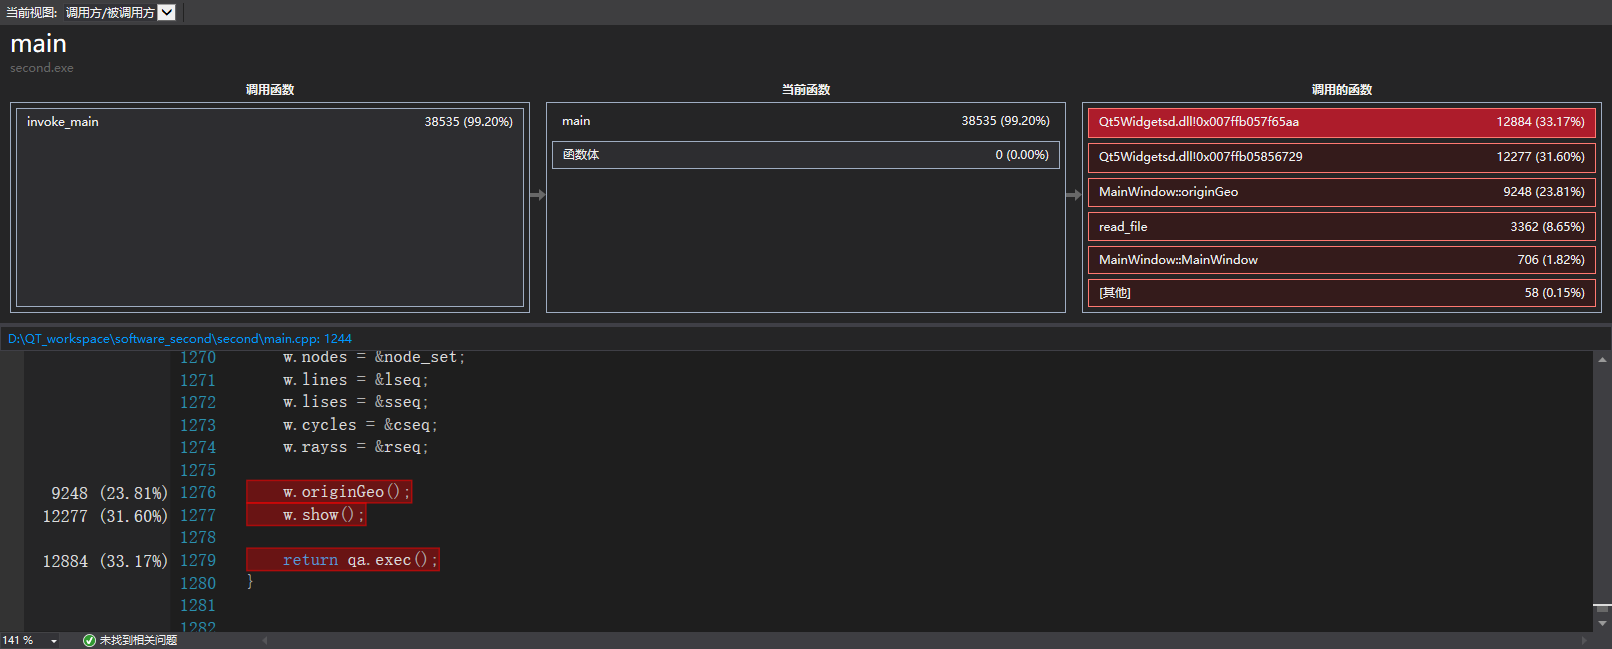
计算模块性能分析
在2000条测试数据下:read_file()函数为总的计算花费,而originGeo()函数和show()函数分别是图形的添加和图形的绘制,本次作业的性能瓶颈为图像的绘制,因为采用第三方库的缘故,所以很难进行更进一步的优化。

可以看到图像绘制占用了总体CPU时间的31.8%
DbC & Code Contract
契约式设计:
要求软件设计者为软件组件定义正式的,精确的并且可验证的接口,这样,为传统的抽象数据类型又增加了先验条件、后验条件和不变式。这种方法的名字里用到的“契约”或者说“契约”是一种比喻,因为它和商业契约的情况有点类似。
DbC能够帮助代码复用,有效的规格与限制条件能够帮助程序员在编码时减少bug,其先验、后验条件与不变式等能够确保接口等的正确性。
我们这一次设计的接口比较简单,主要是传递string,里面是与文件中相同的信息,对于DbC没怎么用到。
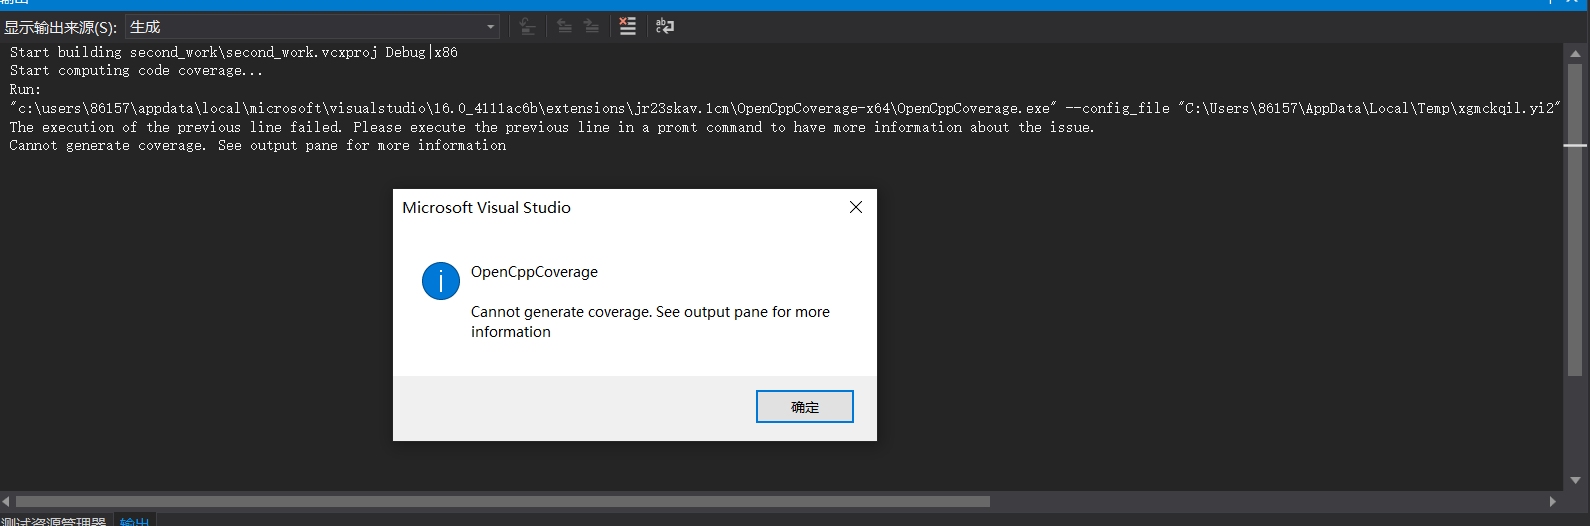
单元测试
单元测试进行了11个测试,均通过,分别包含大量数据、平行线、两射线交点重合斜率相同方向相反等情况。
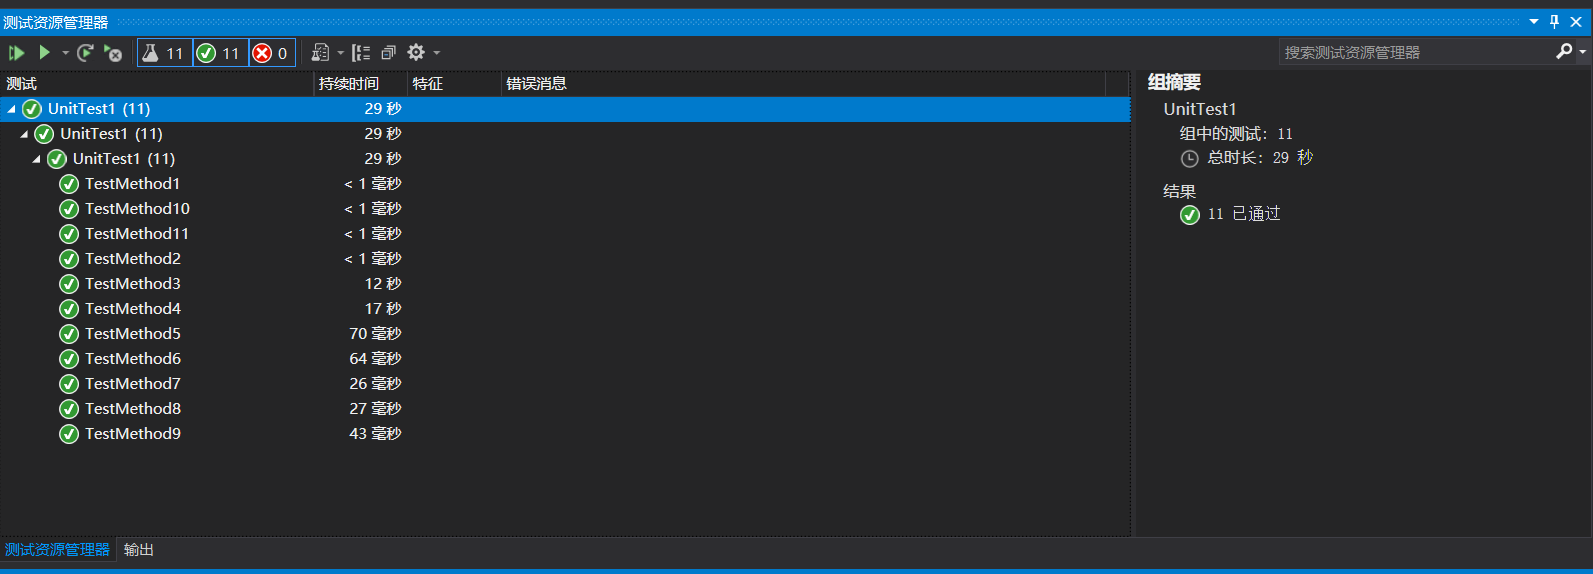
遗憾的是不知道为什么OpenCppcoverage插件报错不运行,我们都没能解决。
异常处理
异常处理模块我们也采用了前后端分离的模式,分为几种情形:
- 读到错误文件名时:
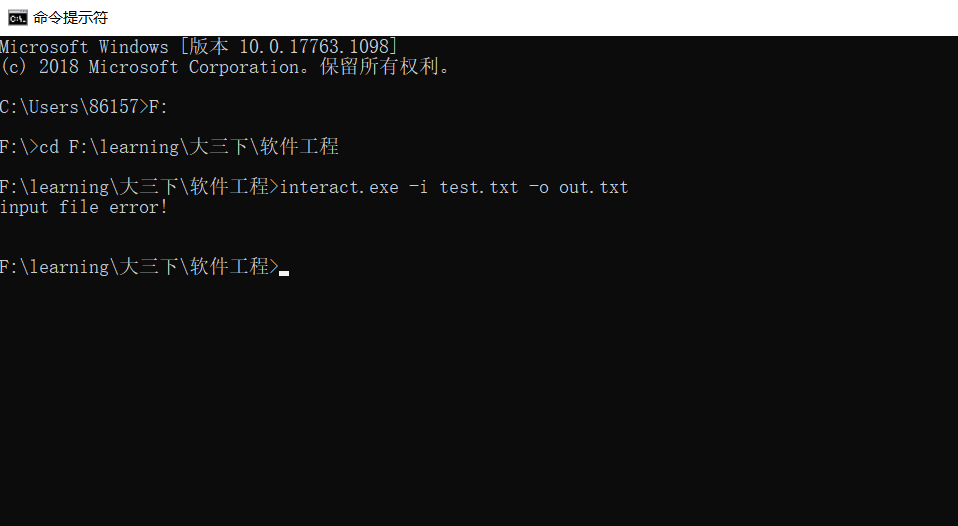
- 当第一次文件读入存在错误时,不绘制UI界面,直接结束程序
输入文件为
效果如图所示:

- 当从UI界面提交文件格式错误时,输出“wrong input”,
输入样例同上
输出为:
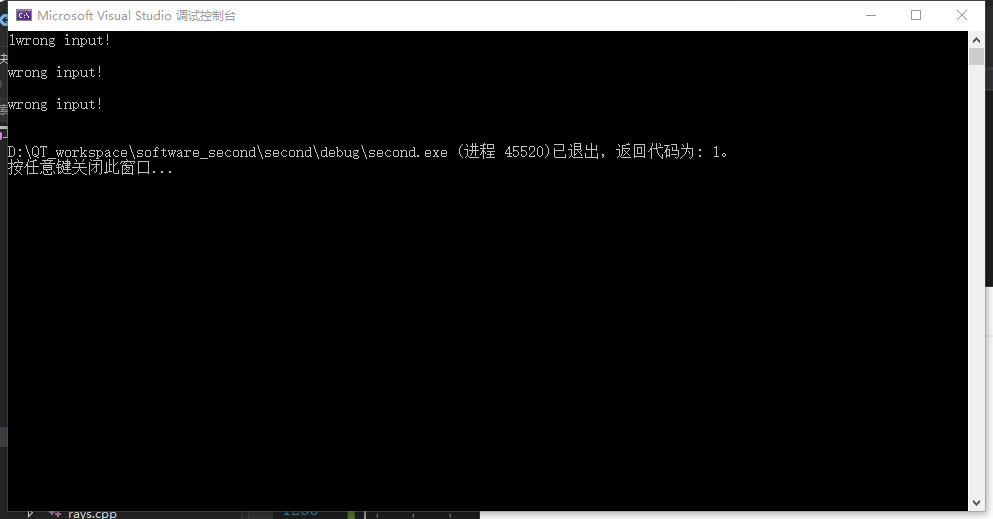
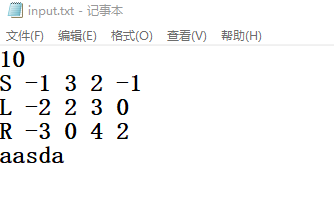
- 当输入实际图形少于给出的数据总数时,测试如下:
输入数据:
输出结果:

十、界面模块的详细设计过程。在博客中详细介绍界面模块是如何设计的,并写一些必要的代码说明解释实现过程。(5')
我们的界面设计使用了QT库,还是用了QCustomplot这样一个第三方库,部分代码借鉴了Qcustomplot的样例模板,界面布局如下图:

大部分功能使用了按键与槽函数的结合,代码举例如下:
//可拖动
customPlot->setInteraction(QCP::iRangeDrag, true);

//可缩放
customPlot->setInteraction(QCP::iRangeZoom, true);

//曲线可选
customPlot->setInteraction(QCP::iSelectPlottables, true);

//曲线 ctrl 多选
customPlot->setInteraction(QCP::iMultiSelect, true);

//坐标轴可选
customPlot->setInteraction(QCP::iSelectAxes, true);
//图例可选
customPlot->setInteraction(QCP::iSelectLegend, true);
// 选中轴时上下轴一起被选中
connect(customPlot, SIGNAL(selectionChangedByUser()), this,SLOT(selectionChanged()));
// 选中轴时,鼠标拖动智能移动一边的轴,滚轮也是一样
connect(customPlot, SIGNAL(mousePress(QMouseEvent*)), this,SLOT(mousePress()));
connect(customPlot, SIGNAL(mouseWheel(QWheelEvent*)), this,SLOT(mouseWheel()));

//多选框切换时,直线输入切换成圆输入
connect(ui->comboBox,SIGNAL(activated(int)),this,SLOT(switchGeo()));

connect(ui->pushButton,SIGNAL(clicked()),this,SLOT(addGeo()));

//文件输入
connect(ui->pushButton_2, SIGNAL(clicked()), this,SLOT(fileInput()));
十一、界面模块与计算模块的对接。详细地描述 UI 模块的设计与两个模块的对接,并在博客中截图实现的功能。(4')
前端后端对接使用了5个容器:
map <node, int>* nodes;
vector<line>* lines;
vector<rays>* rayss;
vector<lise>* lises;
vector<Cycle>* cycles;
5个指针指向后端的全局变量,得到计算出的交点、直线、圆的所有信息,绘制图形的代码如下:
void MainWindow::originGeo() {

	//画交点
	QVector<double> nodex;
	QVector<double> nodey;
	for (map <node, int>::iterator iter = (*nodes).begin(); iter != (*nodes).end(); iter++) {
		node temp = iter->first;
		double x = temp.getX();
		double y = temp.getY();
		nodex.push_back(x);
		nodey.push_back(y);
	}
	QCPGraph* graph = customPlot->addGraph();
	graph->setData(nodex, nodey);
	graph->setScatterStyle(QCPScatterStyle(QCPScatterStyle::ScatterShape::ssDisc, 5));
	QPen graphPen;
	graphPen.setColor(QColor(255,255,255));
	graphPen.setWidthF(rand() / (double)RAND_MAX * 2 + 1);
	graph->setPen(graphPen);
	graph->setName("交点集合");

	int cnt = (*nodes).size();
	ui->lineEdit_8->setText(QString::number(cnt));

	if (cnt >= 20) {
		customPlot->legend->setVisible(true);
	}

	//----------------------------------------
	//画直线
	int linesize = (*lines).size();
	for (int i = 0; i < linesize; i++) {
		line l = (*lines)[i];
		int x1 = l.getNode1().getX();
		int y1 = l.getNode1().getY();
		int x2 = l.getNode2().getX();
		int y2 = l.getNode2().getY();
		if (l.getExitK()) {
			double k = l.getK();
			double b = (-1) * l.getC() / l.getB();
			for (int i = 0; i < 10000; i++) {
				(*valueY)[i] = k * (*indexX)[i] + b;
			}
			QCPGraph* graph = customPlot->addGraph();
			graph->setData(*indexX, *valueY);
		}
		else {
			//斜率不存在时不支持画图
			continue;
		}
		QPen graphPen;
		graphPen.setColor(QColor(rand() % 245 + 10, rand() % 245 + 10, rand() % 245 + 10));
		graphPen.setWidthF(rand() / (double)RAND_MAX * 2 + 1);
		customPlot->graph()->setPen(graphPen);
		//customPlot->graph()->setName("line(编号:" + QString::number(customPlot->graphCount()) + ")");
		const QString name = "L " + QString::number(x1) + " " + QString::number(y1) + " " + QString::number(x2) + " " + QString::number(y2);
		customPlot->graph()->setName(name);
	}

	//----------------------------------------
	//画射线
	int raysize = (*rayss).size();
	for (int i = 0; i < raysize; i++) {
		rays ray = (*rayss)[i];
		int x1 = ray.getStart().getX();
		int y1 = ray.getStart().getY();
		int x2 = ray.getN().getX();
		int y2 = ray.getN().getY();
		if (ray.getExitK()) {
			double k = ray.getK();
			double b = (-1) * ray.getC() / ray.getB();
			QVector<double> fx;
			QVector<double> fy;
			for (int i = 0; i < 10000; i++) {
				(*valueY)[i] = k * (*indexX)[i] + b;
				node tempnode((*indexX)[i], (*valueY)[i]);
				if (ray.judge(tempnode)) {
					fx.push_back((*indexX)[i]);
					fy.push_back((*valueY)[i]);
				}
			}
			QCPGraph* graph = customPlot->addGraph();
			graph->setData(fx, fy);
		}
		else {
			//斜率不存在时不支持画图
			continue;
		}
		QPen graphPen;
		graphPen.setColor(QColor(rand() % 245 + 10, rand() % 245 + 10, rand() % 245 + 10));
		graphPen.setWidthF(rand() / (double)RAND_MAX * 2 + 1);
		customPlot->graph()->setPen(graphPen);
		const QString name = "R " + QString::number(x1) + " " + QString::number(y1) + " " + QString::number(x2) + " " + QString::number(y2);
		//customPlot->graph()->setName("ray(编号:" + QString::number(customPlot->graphCount()) + ")");
		customPlot->graph()->setName(name);
	}

	//----------------------------------------
	//画线段
	int lisesize = (*lises).size();
	for (int i = 0; i < lisesize; i++) {
		lise ls = (*lises)[i];
		int x1 = ls.getNode1().getX();
		int y1 = ls.getNode1().getY();
		int x2 = ls.getNode2().getX();
		int y2 = ls.getNode2().getY();
		if (ls.getExitK()) {
			double k = ls.getK();
			double b = (-1) * ls.getC() / ls.getB();
			QVector<double> fx;
			QVector<double> fy;
			for (int i = 0; i < 10000; i++) {
				(*valueY)[i] = k * (*indexX)[i] + b;
				node tempnode((*indexX)[i], (*valueY)[i]);
				if (ls.judge(tempnode)) {
					fx.push_back((*indexX)[i]);
					fy.push_back((*valueY)[i]);
				}
			}
			QCPGraph* graph = customPlot->addGraph();
			graph->setData(fx, fy);
		}
		else {
			//斜率不存在时不支持画图
			continue;
		}
		QPen graphPen;
		graphPen.setColor(QColor(rand() % 245 + 10, rand() % 245 + 10, rand() % 245 + 10));
		graphPen.setWidthF(rand() / (double)RAND_MAX * 2 + 1);
		customPlot->graph()->setPen(graphPen);
		const QString name = "S " + QString::number(x1) + " " + QString::number(y1) + " " + QString::number(x2) + " " + QString::number(y2);
		customPlot->graph()->setName(name);

	}

	//----------------------------------------
	//画圆
	int circlesize = (*cycles).size();
	valueY1 = new QVector<double>(10000);
	for (int i = 0; i < circlesize; i++) {
		Cycle c = (*cycles)[i];
		int x = c.getC().getX();
		int y = c.getC().getY();
		int r = c.getR();
		const QString name = "C " + QString::number(x) + " " + QString::number(y) + " " + QString::number(r);
		r = r * r;
		double temp = 0;
		double temp1 = 0;
		for (int i = 0; i < 10000; i++) {
			temp = ((*indexX)[i] - x) * ((*indexX)[i] - x);
			temp1 = sqrt(r - temp);
			(*valueY)[i] = y + temp1;
			(*valueY1)[i] = y - temp1;
		}
		//int cnt = customPlot->graphCount();


		customPlot->addGraph();
		customPlot->graph()->setData(*indexX, *valueY);
		customPlot->graph()->setName(name);
		customPlot->addGraph();
		customPlot->graph()->setData(*indexX, *valueY1);
		customPlot->graph()->setName(name);
	}

	customPlot->replot();
	return;
}
功能包括:
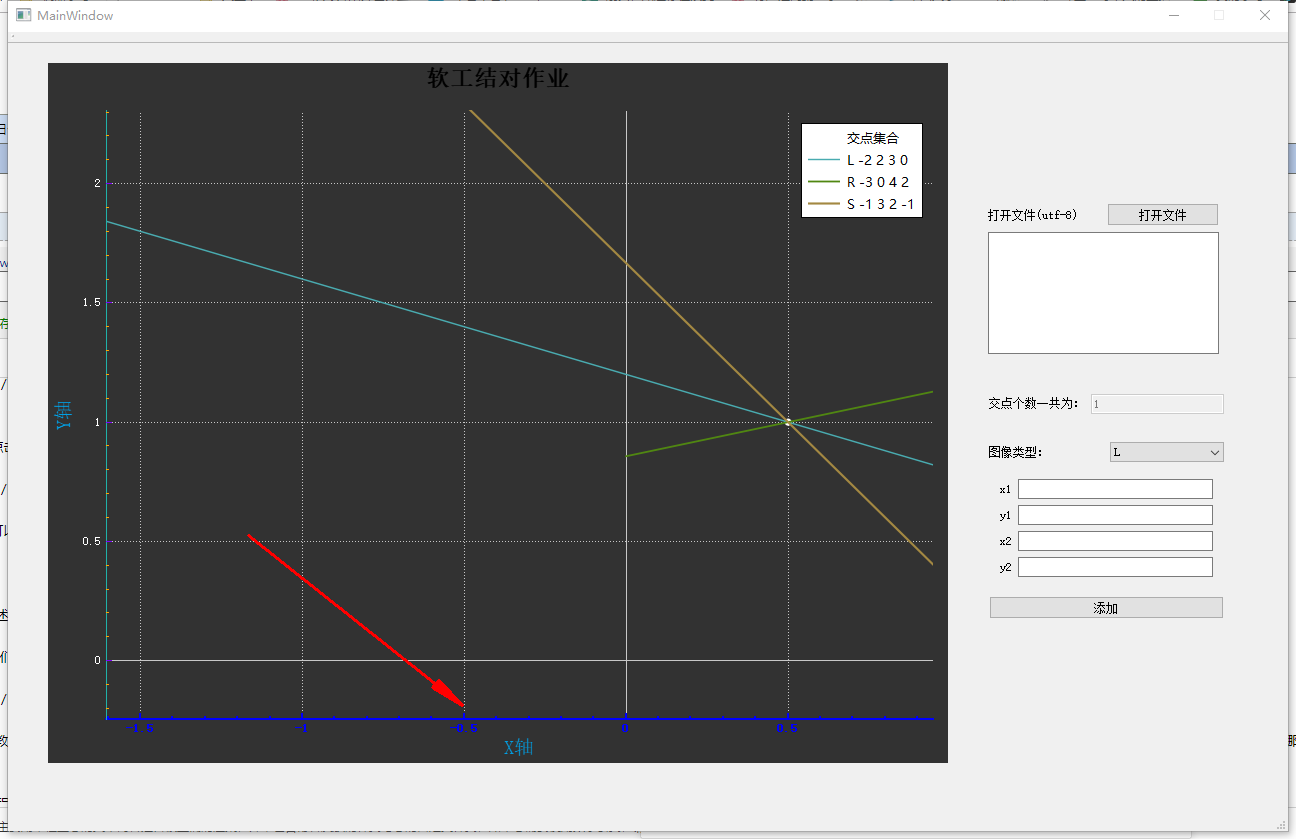
- 可以在图像上直接选择图形进行删除,删除两条直线后如下图(交点个数随之变化):
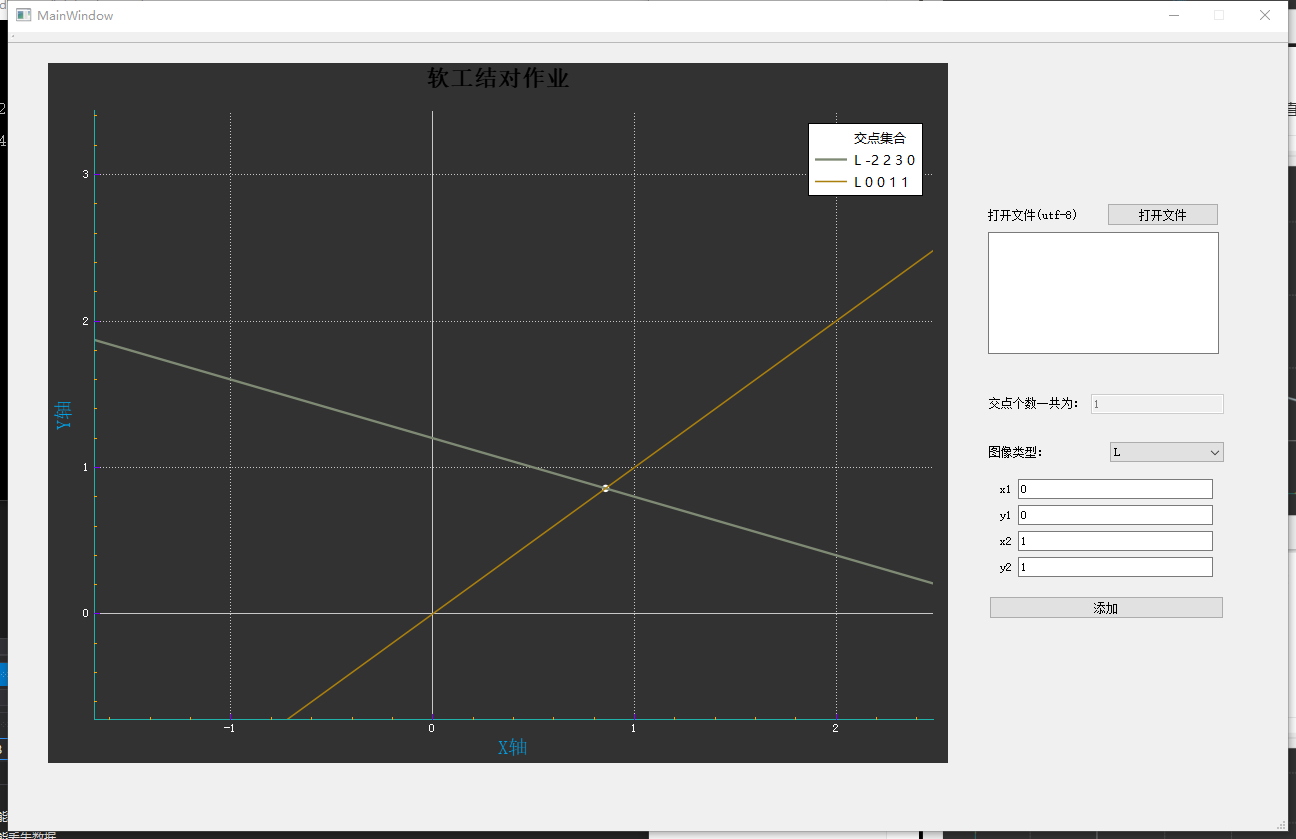
- 右侧栏可以添加直线,并更新交点,操作如下图:
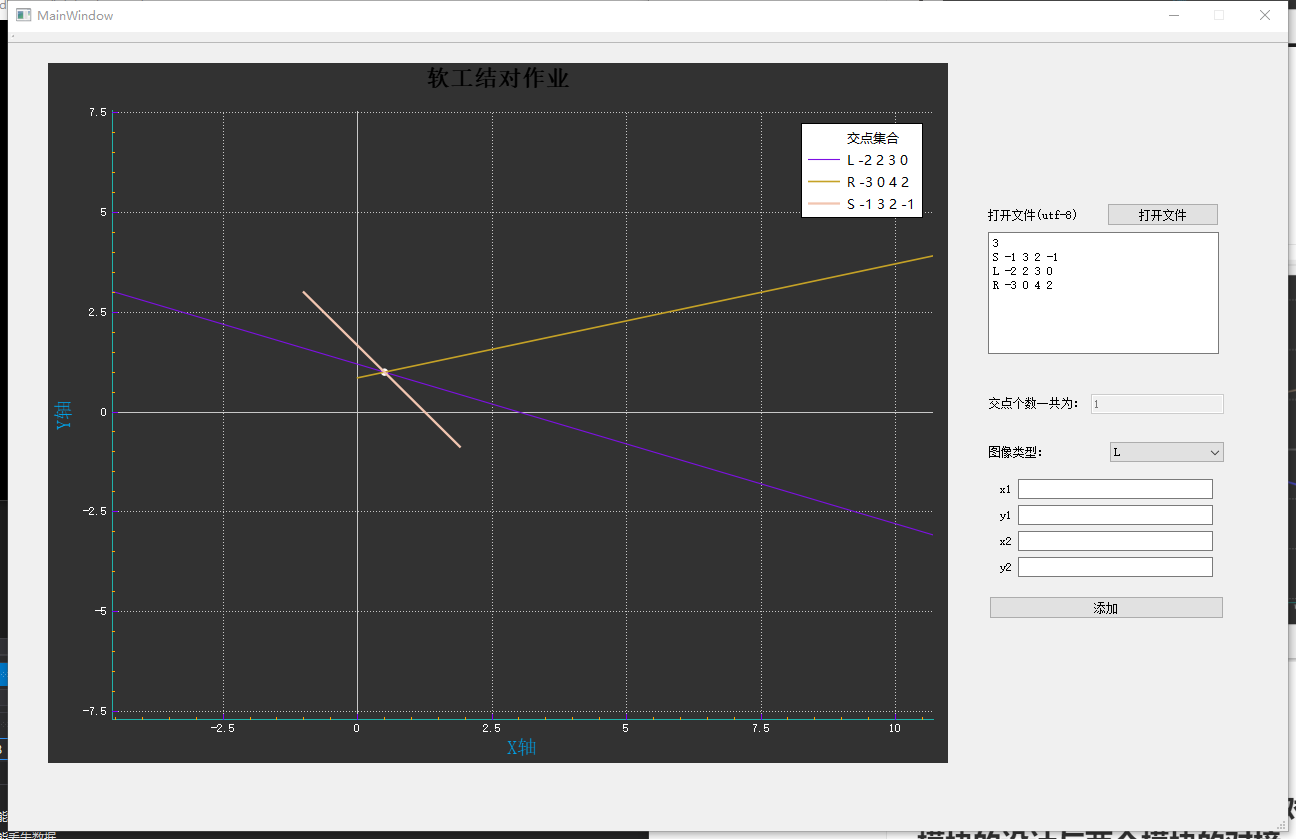
- 右侧栏可以读取文件,文件内容在白色框中显示,如下图:
- 图像点击后提示点击所在的位置坐标,如下图
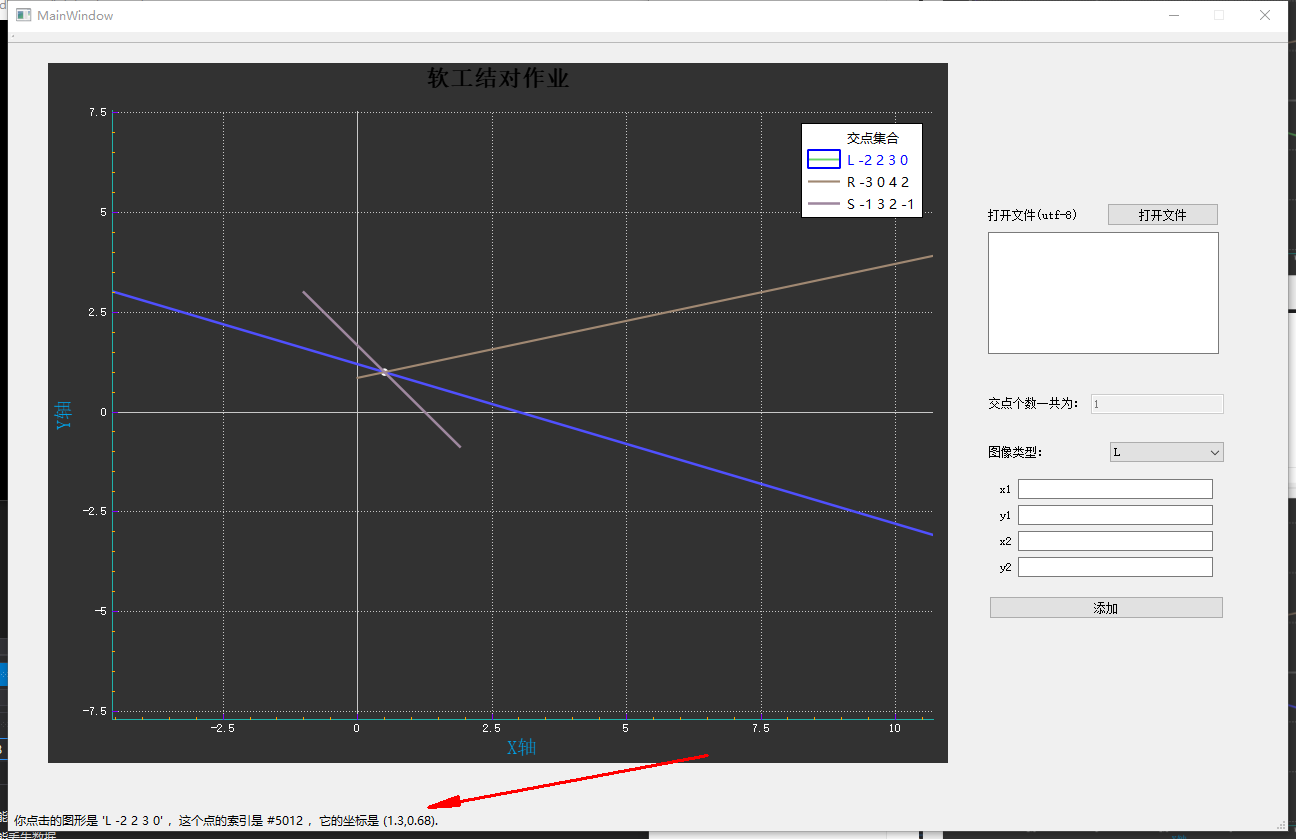
- 图像可以进行伸缩和拉伸,单机轴可以进行拖动,双击轴可以进行修改轴名

描述结对的过程,提供两人在讨论的结对图像资料(比如 Live Share 的截图)。关于如何远程进行结对参见作业最后的注意事项。
结对过程中我们进行了详细的分工,黎正宇负责后端逻辑,吴凡负责前端UI设计。商量好接口后我们进行了语音然后一起编程。
看教科书和其它参考书,网站中关于结对编程的章节,说明结对编程的优点和缺点。同时描述结对的每一个人的优点和缺点在哪里(要列出至少三个优点和一个缺点)。
结对编程的优点:
- 分工协作,各取所长,减少了学习成本
- 两人可以交换想法得到更多的灵感
- 提高了代码的可读性
- 互相检查,找到思维盲区,减少bug
结对编程的缺点:
- 两个人的时间安排可能不太一致,开始时协调不太好
PSP时间分析
| PSP2.1 | Personal Software Process Stages | 预估耗时(分钟) | 实际耗时(分钟) |
|---|---|---|---|
| Planning | 计划 | ||
| · Estimate | · 估计这个任务需要多少时间 | 30 | 15 |
| Development | 开发 | ||
| · Analysis | · 需求分析 (包括学习新技术) | 90 | 120 |
| · Design Spec | · 生成设计文档 | 10 | 15 |
| · Design Review | · 设计复审 (和同事审核设计文档) | 15 | 20 |
| · Coding Standard | · 代码规范 (为目前的开发制定合适的规范) | 10 | 15 |
| · Design | · 具体设计 | 40 | 40 |
| · Coding | · 具体编码 | 60 | 300 |
| · Code Review | · 代码复审 | 30 | 120 |
| · Test | · 测试(自我测试,修改代码,提交修改 | 20 | 90 |
| Reporting | 报告 | ||
| · Test Report | · 测试报告 | 40 | 40 |
| · Size Measurement | · 计算工作量 | 10 | 10 |
| · Postmortem & Process Improvement Plan | · 事后总结, 并提出过程改进计划 | 30 | 20 |
| 合计 | 375 | 805 |