springcloud-Sleuth 与 Zipkin 结合图形化展示
- 分布式追踪相关基础概念
- Google Dapper 论文和 Zipkin
- Spring Cloud Sleuth 介绍及使用
- Spring Cloud Sleuth 与 Zipkin 结合使用进行图形化展示
通过 Spring Cloud Sleuth 来实现调用链监控以此来帮助我们快速定位系统是哪个环节出了问题。通过调用链监控服务,我们可以快速定位出是微服务的问题、网络问题或是其他问题。
通常一个系统都是有数十个、上百个服务组成的。服务与服务之间或多或少都会进行相互调用通信。整个请求路径就构成了一个网状的调用链,而在整个调用链中一旦某个节点发生异常,整个调用链的稳定性就会受到影响。 面对以上情况,我们就需要一些可以帮助理解系统行为、用于分析性能问题的工具,以便发生故障的时候,能够快速定位和解决问题。
目前大多数的开源或者商业产品都参考了 Google 发布的一篇论文《Dapper》,里面描述了可参考的实现分布式追踪系统(APM)的方式。下图中描述了基础模块:
其中包含了用于客户端采集信息的探针或者 SDK,收集采集信息的服务端以及存储收集结果的存储引擎。一般用分布式追踪系统揽括这三大模块。
Spring Cloud 中关于 Sleuth 和 Zipkin 也参考了该实现,更多内容就不在这里细述。我们还是以动手实践为主。
使用
- 引入 Sleuth 依赖:
<dependency>
  <groupId>org.springframework.cloud</groupId>
  <artifactId>spring-cloud-starter-sleuth</artifactId>
</dependency>
- 修改
application.yml配置文件,增加如下内容:
logging:
  level:
    root: INFO
    ......
    org.springframework.cloud.sleuth: DEBUG
    ......
C:Usersljavademomicroservice-provider-user>curl http://localhost:8000/users/2
{"id":2,"username":"account2","name":"鏉庡洓","age":28,"balance":180.00}
Hibernate: select user0_.id as id1_0_0_, user0_.age as age2_0_0_, user0_.balance as balance3_0_0_, user0_.name as name4_0_0_, user0_.username as username5_0_0_ from user user0_ where user0_.id=?
2021-02-20 18:31:55.070 TRACE [microservice-provider-user,79ae2adc64548a89,79ae2adc64548a89,false] 19332 --- [nio-8000-exec-1] o.h.type.descriptor.sql.BasicBinder      : binding parameter [1] as [BIGINT] - [2]
2021-02-20 18:31:55.076 TRACE [microservice-provider-user,79ae2adc64548a89,79ae2adc64548a89,false] 19332 --- [nio-8000-exec-1] o.h.type.descriptor.sql.BasicExtractor   : extracted value ([age2_0_0_] : [INTEGER]) - [28]
2021-02-20 18:31:55.077 TRACE [microservice-provider-user,79ae2adc64548a89,79ae2adc64548a89,false] 19332 --- [nio-8000-exec-1] o.h.type.descriptor.sql.BasicExtractor   : extracted value ([balance3_0_0_] : [NUMERIC]) - [180.00]
2021-02-20 18:31:55.077 TRACE [microservice-provider-user,79ae2adc64548a89,79ae2adc64548a89,false] 19332 --- [nio-8000-exec-1] o.h.type.descriptor.sql.BasicExtractor   : extracted value ([name4_0_0_] : [VARCHAR]) - [李四]
2021-02-20 18:31:55.077 TRACE [microservice-provider-user,79ae2adc64548a89,79ae2adc64548a89,false] 19332 --- [nio-8000-exec-1] o.h.type.descriptor.sql.BasicExtractor   : extracted value ([username5_0_0_] : [VARCHAR]) - [account2]
是不是觉得看着这个毫无头绪,也看不出来个究竟。一个良好的监控,应该有一个人类亲和的界面,这个界面就是 Zipkin。 那么,我们接下来就结合Zipkin来帮助我们吧
Zipkin
Zipkin 是 Twitter 开源的分布式跟踪系统,基于 Dapper 的论文设计而来。它的主要功能是收集系统的时序数据,从而追踪微服务架构的系统延时等问题。Zipkin 还提供了一个非常友好的界面,帮助我们分析追踪数据。
Zipkin 是一个开放源代码分布式的跟踪系统,每个服务向zipkin报告计时数据,zipkin会根据调用关系通过Zipkin UI生成依赖关系图。
Zipkin提供了可插拔数据存储方式:In-Memory、MySql、Cassandra以及Elasticsearch。为了方便在开发环境我直接采用了In-Memory方式进行存储,生产数据量大的情况则推荐使用Elasticsearch。
基本术语
- Span:基本工作单元,例如,在一个新建的span中发送一个RPC等同于发送一个回应请求给RPC,span通过一个64位ID唯一标识,trace以另一个64位ID表示,span还有其他数据信息,比如摘要、时间戳事件、关键值注释(tags)、span的ID、以及进度ID(通常是IP地址)
span在不断的启动和停止,同时记录了时间信息,当你创建了一个span,你必须在未来的某个时刻停止它。 - Trace:一系列spans组成的一个树状结构,例如,如果你正在跑一个分布式大数据工程,你可能需要创建一个trace。
- Annotation:用来及时记录一个事件的存在,一些核心annotations用来定义一个请求的开始和结束
- cs - Client Sent -客户端发起一个请求,这个annotion描述了这个span的开始
- sr - Server Received -服务端获得请求并准备开始处理它,如果将其sr减去cs时间戳便可得到网络延迟
- ss - Server Sent -注解表明请求处理的完成(当请求返回客户端),如果ss减去sr时间戳便可得到服务端需要的处理请求时间
- cr - Client Received -表明span的结束,客户端成功接收到服务端的回复,如果cr减去cs时间戳便可得到客户端从服务端获取回复的所有所需时间
将Span和Trace在一个系统中使用Zipkin注解的过程图形化:
我们需要将前面 Sleuth 采集到的数据发送给 Zipkin 服务端。Zipkin 分析之后展示在界面上。

因此,我们需要启动 Zipkin Server。这里我们使用编译好的可运行 Jar 包直接启动。使用 https://search.maven.org/remote_content?g=io.zipkin.java&a=zipkin-server&v=LATEST&c=exec 下载最新版本的 Zipkin Server,例如 zipkin-server-2.12.9-exec.jar。

或者你也可以直接下载我们准备好的 jar 包:

wget https://labfile.oss.aliyuncs.com/courses/1360/zipkin-server-2.12.9-exec.jar

启动 Zipkin Server
java -jar zipkin-server-2.12.9-exec.jar

访问 http://localhost:9411 ,即可看到 Zipkin Server 的首页。
通过以下命令启动服务,默认INFO级别可以不设置logging
java -jar zipkin-server-2.12.9-exec.jar --logging.level.zipkin2=INFO
STORAGE_TYPE=elasticsearch ES_HOSTS=http://myhost:9200 java -jar zipkin.jar
接着,为我们上面步骤的用户服务整合 Zipkin,使其能够把数据发送给 Zipkin Server。
- 在用户服务中添加依赖:
<dependency>
  <groupId>org.springframework.cloud</groupId>
  <artifactId>spring-cloud-sleuth-zipkin</artifactId>
</dependency>
- 在
application.yml中添加配置:
spring:
    ......
    zipkin:
        base-url: http://localhost:9411
    sleuth:
        sampler:
            probability: 1.0
spring:
  zipkin:
    base-url: http://127.0.0.1:9411
  sleuth:
    sampler:
      percentage: 1.0
base-url是zipkin服务端的地址,percentage是采样比例,设置为1.0时代表全部强求都需要采样。Sleuth默认采样算法的实现是Reservoir sampling,具体的实现类是PercentageBasedSampler,默认的采样比例为: 0.1(即10%)。- 测试运行
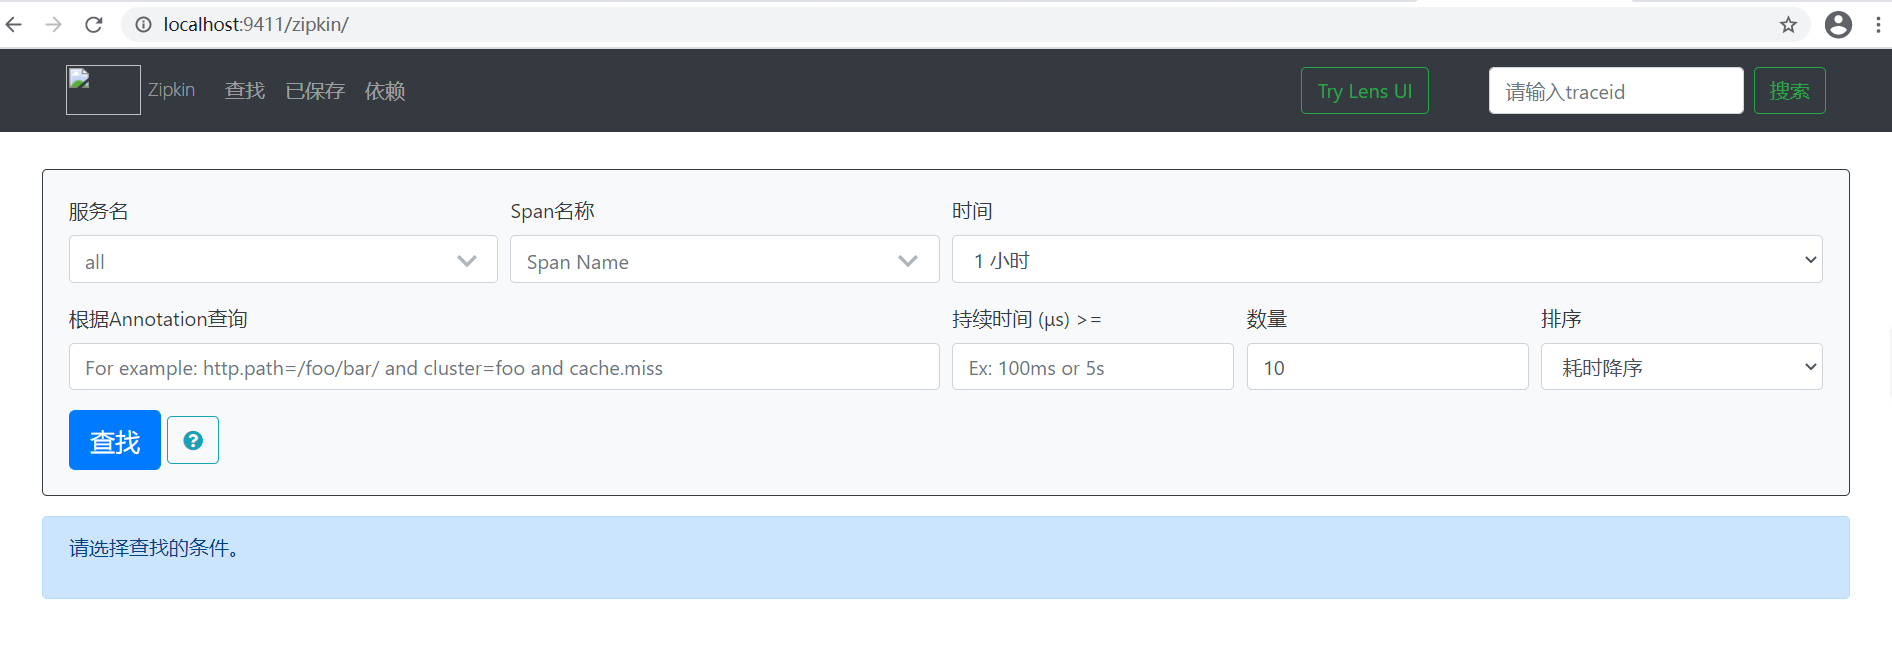
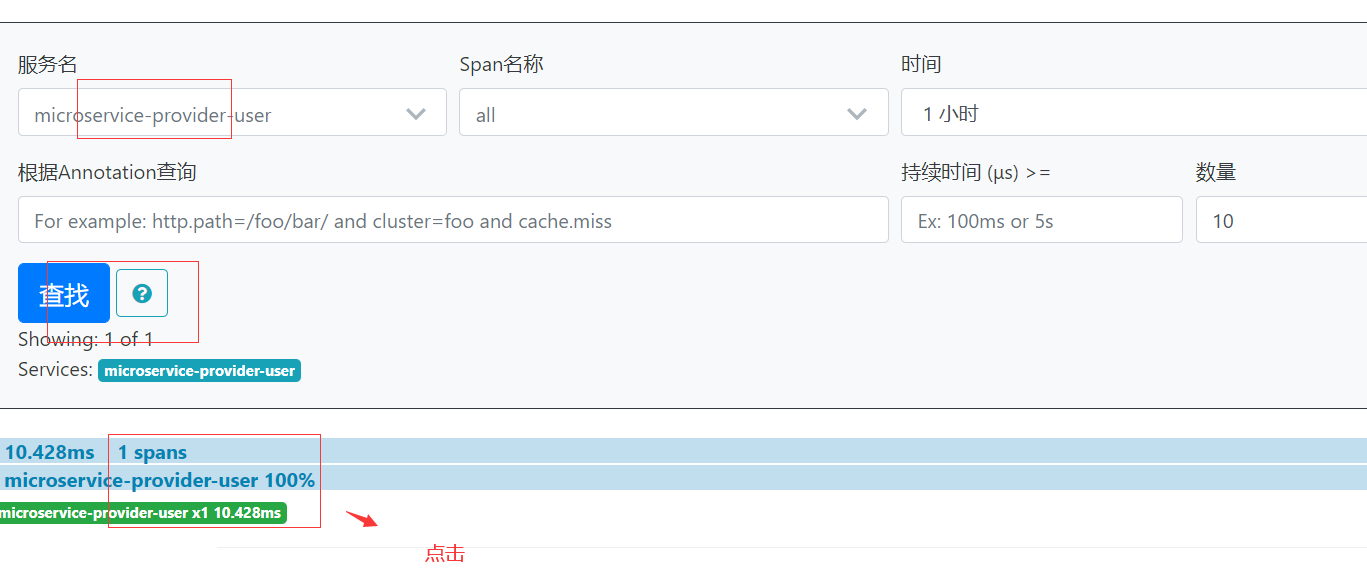
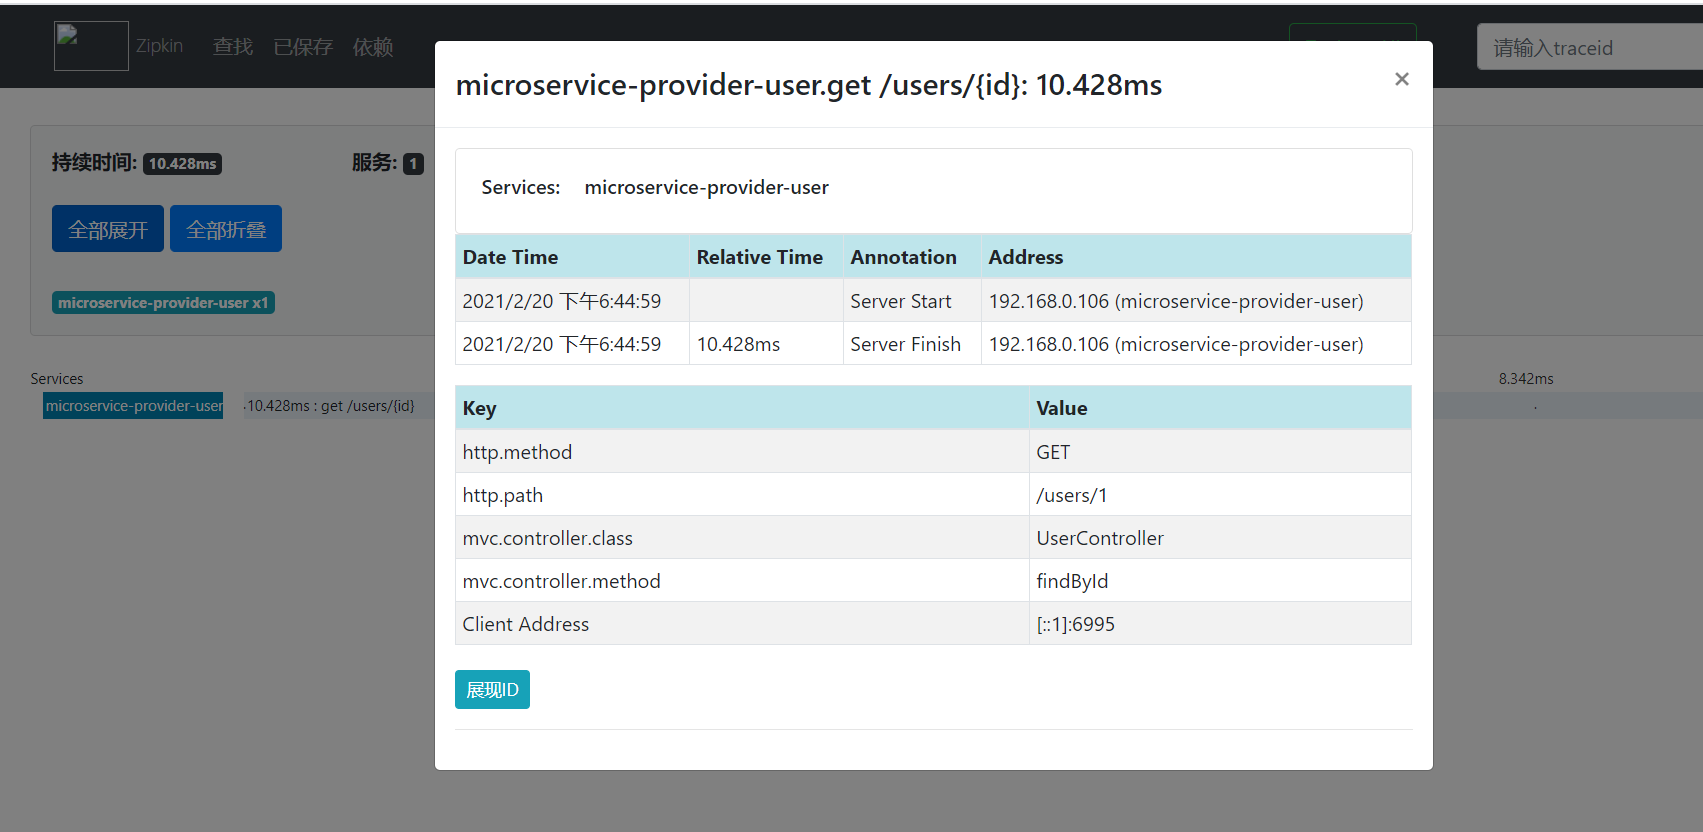
启动微服务,访问 http://localhost:8000/users/2,然后浏览器访问 http://localhost:9411,可看到类似如下界面
http://localhost:8000/users/2 // 访问这个url,看到日志,trap-executor-0,还需要等待一段时间,才能在zipinweb页面查询到执行这个url查询花费的时间
Hibernate: select user0_.id as id1_0_0_, user0_.age as age2_0_0_, user0_.balance as balance3_0_0_, user0_.name as name4_0_0_, user0_.username as username5_0_0_ from user user0_ where user0_.id=?
2021-02-20 18:45:17.221 TRACE [microservice-provider-user,3db39898b7464cc8,3db39898b7464cc8,false] 13812 --- [nio-8000-exec-4] o.h.type.descriptor.sql.BasicBinder      : binding parameter [1] as [BIGINT] - [1]
2021-02-20 18:45:17.222 TRACE [microservice-provider-user,3db39898b7464cc8,3db39898b7464cc8,false] 13812 --- [nio-8000-exec-4] o.h.type.descriptor.sql.BasicExtractor   : extracted value ([age2_0_0_] : [INTEGER]) - [20]
2021-02-20 18:45:17.222 TRACE [microservice-provider-user,3db39898b7464cc8,3db39898b7464cc8,false] 13812 --- [nio-8000-exec-4] o.h.type.descriptor.sql.BasicExtractor   : extracted value ([balance3_0_0_] : [NUMERIC]) - [100.00]
2021-02-20 18:45:17.222 TRACE [microservice-provider-user,3db39898b7464cc8,3db39898b7464cc8,false] 13812 --- [nio-8000-exec-4] o.h.type.descriptor.sql.BasicExtractor   : extracted value ([name4_0_0_] : [VARCHAR]) - [张三]
2021-02-20 18:45:17.222 TRACE [microservice-provider-user,3db39898b7464cc8,3db39898b7464cc8,false] 13812 --- [nio-8000-exec-4] o.h.type.descriptor.sql.BasicExtractor   : extracted value ([username5_0_0_] : [VARCHAR]) - [account1]
2021-02-20 18:49:11.673  INFO [microservice-provider-user,,,] 13812 --- [trap-executor-0] c.n.d.s.r.aws.ConfigClusterResolver      : Resolving eureka endpoints via configuration
zipin2
https://zipkin.io/pages/quickstart

Quickstart
In this section we’ll walk through building and starting an instance of Zipkin for checking out Zipkin locally. There are three options: using Java, Docker or running from source.

If you are familiar with Docker, this is the preferred method to start. If you are unfamiliar with Docker, try running via Java or from source.

Regardless of how you start Zipkin, browse to http://your_host:9411 to find traces!

Docker
The Docker Zipkin project is able to build docker images, provide scripts and a docker-compose.yml for launching pre-built images. The quickest start is to run the latest image directly:

docker run -d -p 9411:9411 openzipkin/zipkin
Java
If you have Java 8 or higher installed, the quickest way to get started is to fetch the latest release as a self-contained executable jar:

curl -sSL https://zipkin.io/quickstart.sh | bash -s
java -jar zipkin.jar
Running from Source
Zipkin can be run from source if you are developing new features. To achieve this, you’ll need to get Zipkin’s source and build it.

# get the latest source
git clone https://github.com/openzipkin/zipkin
cd zipkin
# Build the server and also make its dependencies
./mvnw -DskipTests --also-make -pl zipkin-server clean install
# Run the server
java -jar ./zipkin-server/target/zipkin-server-*exec.jar
Stop by and socialize with us on gitter, if you end up making something interesting!
从分布式追踪理论出处讲起,接着是改造前面的服务,让其调用信息能够被调用链追踪服务所记录。不知道你理清楚没有,没关系,实验结束之后利用空余时间跟深入的探究吧。这里另外总结一下,在分布式追踪系统中,目前主要分为手动埋点和自动埋点的两种系统。国内也有一款基于 Java 自动埋点的开源分布式追踪、监控产品—— Apache Skywalking