1、本节重点知识点用自己的话总结出来,可以配上图片,以及说明该知识点的重要性
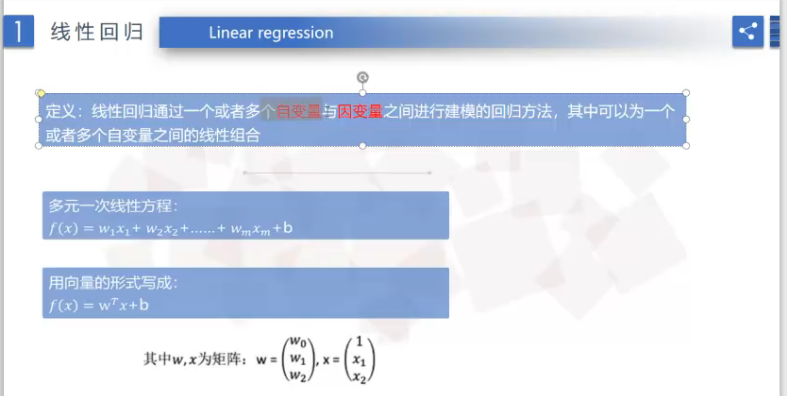
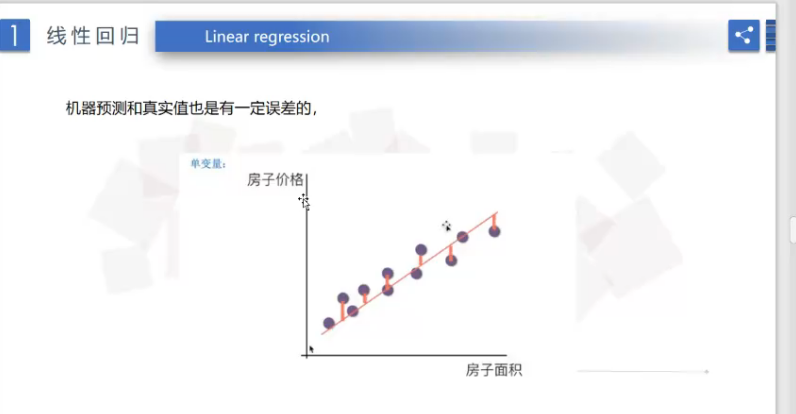
线性回归自变量和因变量直接的关系
线性回归预测房价的误差值是表示点到线之间红色的距离
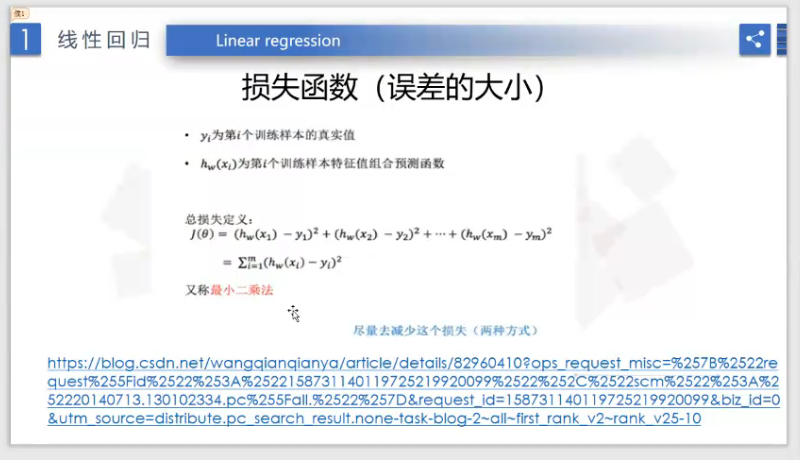
损失函数
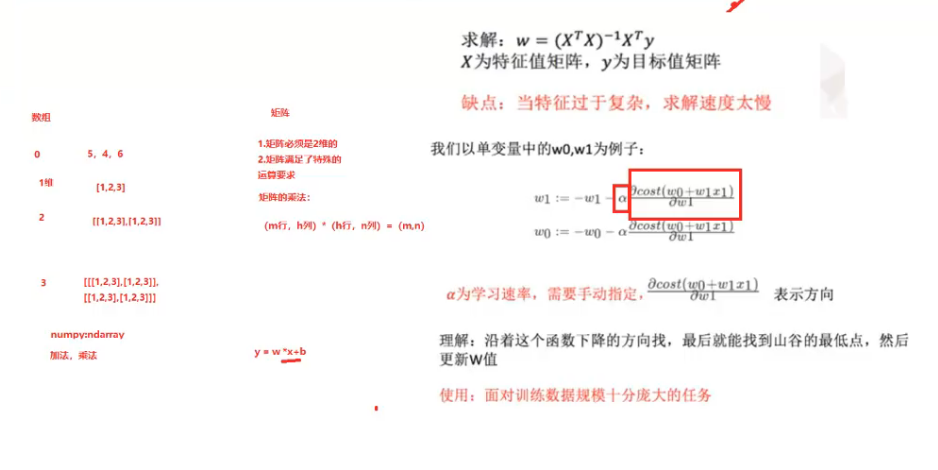
线性回归
import random
import matplotlib.pyplot as plt
xs = [0.1*x for x in range(0,10)]
ys = [12*i+4 for i in xs]
print(xs)
print(ys)
w = random.random()
b = random.random()
a1=[]
b1=[]
for i in range(50):
for x,y in zip(xs,ys):
o = w*x + b
e = (o-y)
loss = e**2
dw = 2*e*x
db = 2*e*1
w = w - 0.1*dw
b = b - 0.1*db
print('loss={0}, w={1}, b={2}'.format(loss,w,b))
a1.append(i)
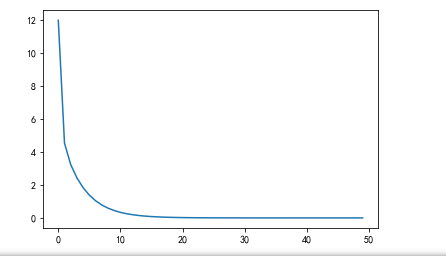
b1.append(loss)
plt.plot(a1,b1)
plt.pause(0.1)
plt.show()
2、思考线性回归算法可以用来做什么?(大家尽量不要写重复)
(1)房价
(2)世界人口增长
(3)高考人数
(4)高效录取人数
(5)股价趋势
(6)物价
3、自主编写线性回归算法 ,数据可以自己造,或者从网上获取。(加分题)
from sklearn.linear_model import LinearRegression
from sklearn.datasets import load_boston
from sklearn.model_selection import train_test_split
# 数据
boston = load_boston()
X = boston['data']
y = boston['target']
names = boston['feature_names']
# 划分数据
X_train,X_test,y_train,y_test = train_test_split(X,y,test_size = 0.2,random_state=125)
# 建立模型
clf = LinearRegression().fit(X_train,y_train)
## 预测
y_pred = clf.predict(X_test)
print('预测前20个结果:','
',y_pred[:20])
import matplotlib.pyplot as plt
from matplotlib import rcParams
rcParams['font.sans-serif'] = 'SimHei'
fig = plt.figure(figsize=(10,6))
#画图
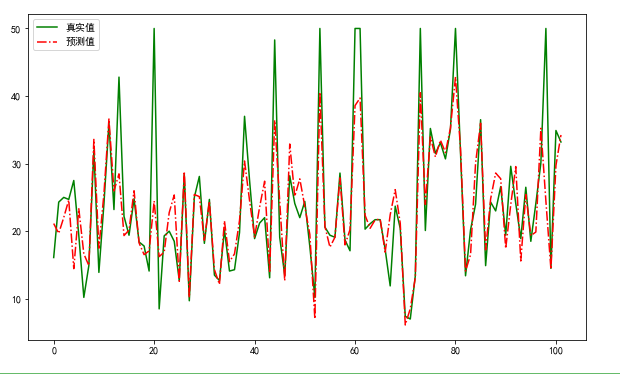
plt.plot(range(y_test.shape[0]),y_test,color="green", linewidth=1.5, linestyle="-")
plt.plot(range(y_test.shape[0]),y_pred,color="red", linewidth=1.5, linestyle="-.")
plt.legend(['真实值','预测值'])
plt.show()