转载请注明出处。
如果想远程管理服务器就有远程管理卡,比如Dell idRAC,HP ILO,IBM IMM
查看硬件的温度/风扇转速,电脑有撸大师,服务器就有ipmitool。使用ipmitool实现对服务器的命令行远程管理
yum -y install OpenIPMI ipmitool  #->IPMI在物理机可以成功,虚拟机不行
[root@KVM ~]# ipmitool sdr type Temperature
Temp             | 01h | ns  |  3.1 | Disabled
Temp             | 02h | ns  |  3.2 | Disabled
Temp             | 05h | ns  | 10.1 | Disabled
Temp             | 06h | ns  | 10.2 | Disabled
Ambient Temp     | 0Eh | ok  |  7.1 | 22 degrees C
Planar Temp      | 0Fh | ns  |  7.1 | Disabled
IOH THERMTRIP    | 5Dh | ns  |  7.1 | Disabled
CPU Temp Interf  | 76h | ns  |  7.1 | Disabled
Temp             | 0Ah | ns  |  8.1 | Disabled
Temp             | 0Bh | ns  |  8.1 | Disabled
Temp             | 0Ch | ns  |  8.1 | Disabled
查看cpu方面
想知道了cpu性能好不好、忙不忙可以用lscpu、uptime、top、htop。


[root@m02 ~]# lscpu
Architecture:          x86_64
CPU op-mode(s):        32-bit, 64-bit
Byte Order:            Little Endian
CPU(s):                1
On-line CPU(s) list:   0
Thread(s) per core:    1
Core(s) per socket:    1
Socket(s):             1
NUMA node(s):          1
Vendor ID:             GenuineIntel
CPU family:            6
Model:                 94
Model name:            Intel(R) Core(TM) i5-6300HQ CPU @ 2.30GHz
Stepping:              3
CPU MHz:               2302.121
CPU max MHz:           0.0000
CPU min MHz:           0.0000
BogoMIPS:              4607.99
Hypervisor vendor:     VMware
Virtualization type:   full
L1d cache:             32K
L1i cache:             32K
L2 cache:              256K
L3 cache:              6144K
NUMA node0 CPU(s):     0
Flags:                 fpu vme de pse tsc msr pae mce cx8 apic sep mtrr pge mca cmov pat pse36 clflush dts mmx fxsr sse sse2 ss syscall nx pdpe1gb rdtscp lm constant_tsc arch_perfmon pebs bts nopl xtopology tsc_reliable nonstop_tsc aperfmperf eagerfpu pni pclmulqdq ssse3 fma cx16 pcid sse4_1 sse4_2 x2apic movbe popcnt tsc_deadline_timer aes xsave avx f16c rdrand hypervisor lahf_lm abm 3dnowprefetch epb fsgsbase tsc_adjust bmi1 hle avx2 smep bmi2 invpcid rtm rdseed adx smap xsaveopt dtherm ida arat pln pts hwp hwp_notify hwp_act_window hwp_epp
cpu负载:
[root@m02 ~]# uptime
 09:11:40 up 18:35,  1 user,  load average: 0.00, 0.05, 0.05
查看内存方面
内存够不够可以用free
[root@cache01 ~]# free -h
       total        used        free      shared  buff/cache   available
Mem:    472M        105M         93M        4.8M        272M        325M
Swap:   1.0G          0B        1.0G
查看磁盘相关
磁盘剩多少写的快不快可以用df、dd、iotop
[root@m01 ~]# yum install iotop -y
[root@m01 ~]# iotop
Total DISK READ :    3.22 M/s | Total DISK WRITE :       3.78 K/s
Actual DISK READ:    3.22 M/s | Actual DISK WRITE:       3.78 K/s
 TID  PRIO  USER     DISK READ  DISK WRITE  SWAPIN     IO>    COMMAND
6794 be/4 root       30.24 K/s    0.00 B/s  0.00 %  4.33 % python /usr/sbin/iotop
3900 be/4 zabbix    0.00 B/s    0.00 B/s  0.00 %  3.02 % zabbix_agentd: listene~aiting for connection]
3901 be/4 zabbix    434.65 K/s    0.00 B/s  0.00 %  2.78 % zabbix_agentd: listene~aiting for connection]
3899 be/4 zabbix    0.00 B/s    0.00 B/s  0.00 %  2.78 % zabbix_agentd: listene~aiting for connection]
3282 be/4 zabbix    2.76 M/s    0.00 B/s  0.00 %  1.48 % zabbix_server: db watchdog [pinging database]
3315 be/4 mysql    0.00 B/s    3.78 K/s  0.00 %  0.05 % mysqld --basedir=/usr ~r/lib/mysql/mysql.sock
   1 be/4 root        0.00 B/s    0.00 B/s  0.00 %  0.00 % systemd --switched-roo~ystem --deserialize 21
   2 be/4 root        0.00 B/s    0.00 B/s  0.00 %  0.00 % [kthreadd]
   3 be/4 root        0.00 B/s    0.00 B/s  0.00 %  0.00 % [ksoftirqd/0]
   5 be/0 root        0.00 B/s    0.00 B/s  0.00 %  0.00 % [kworker/0:0H]
   7 rt/4 root        0.00 B/s    0.00 B/s  0.00 %  0.00 % [migration/0]
   8 be/4 root        0.00 B/s    0.00 B/s  0.00 %  0.00 % [rcu_bh]
   9 be/4 root        0.00 B/s    0.00 B/s  0.00 %  0.00 % [rcu_sched]
查看网络方面
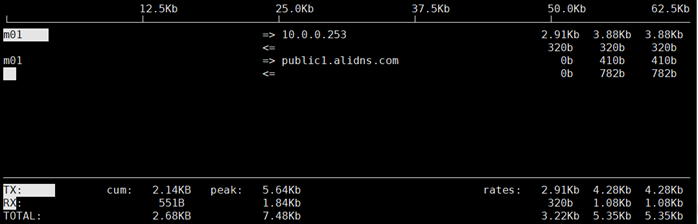
网络太卡找iftop, nethogs
nethogs:

iftop: