1.首先在项目中引入echart.js库。
 1 <!DOCTYPE HTML>
 2 <%@page contentType="text/html; charset=UTF-8" language="java"%>
 3 <%@ taglib prefix="b" uri="/bonc-tags"%>
 4 <%@ taglib prefix="s" uri="/struts-tags"%>
 5 <%@ taglib uri="/struts-tags" prefix="struts"%>
 6 <%String contextPath = request.getContextPath();%>
 7 <html>
 8 <head>
19      <script    src="<%=contextPath%>/resources/echarts/echarts.js" type="text/javascript"></script>
20 </head>
2.建立对应的放图的地方div标签
两个div分别表示一个饼图和一个折线图
1 <div id="method1" style="1350px;height:450px;">
2    <jsp:include page="BusinessMarketFee-method1.jsp"></jsp:include>
3 </div>
4 <div id="meth2" style="1350px;height:450px;">
5    <jsp:include page="BusinessMarketFee-meth2.jsp"></jsp:include>
6 </div>
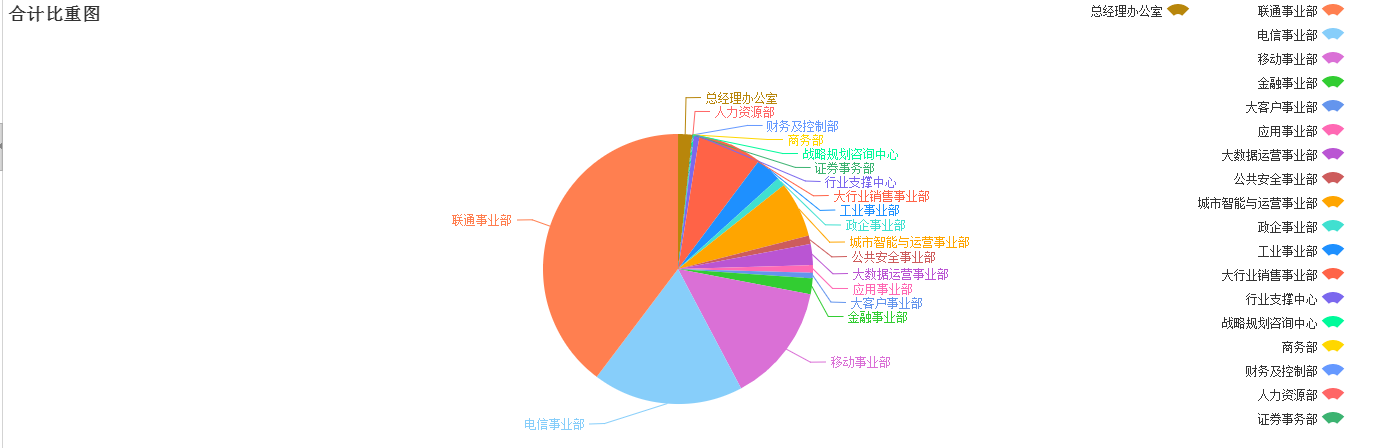
3.饼图的代码:
 1 <!DOCTYPE html>
 2 <%@ page contentType="text/html;charset=UTF-8" language="java"%>
 3 <%@ taglib prefix="b" uri="/bonc-tags"%>
 4 <%String contextPath = request.getContextPath();%>
 5 <html>
 6 <head>
 7   <meta http-equiv="Content-Type" content="text/html; charset=utf-8" />
 8
 9 </head>
10 <body>
11 </body>
12  <script type="text/javascript">
13    function method_1(){
14        //获取参数
15        var o1=$("#acctmonth").val();
16        var departmentName;
17        var totaldata;
18        $.ajax({
19             url:'BusinessMarketFee!getparams.action',
20             data:{acctmonth:o1},
21             async:false,
22             success:function(data){
23                 departmentName=data.departName;
24                 totaldata=data.totalfei;
25             }
26         });
27        //alert(totaldata);
28        if(departmentName==null||departmentName==""){
29            departmentName=['暂无数据']
30        }
31        require.config({
32               paths: {
33                 echarts: '<%=contextPath%>/resources/echarts'
34               }
35        });
36        require(
37         [
38          'echarts',
39          'echarts/chart/line',
40          'echarts/chart/bar',
41          'echarts/chart/pie'
42         ],
43         function drawPie(ec){
44             //图表渲染的容器对象
45             //加载图表
46             var myChart = ec.init(document.getElementById("method1"));
47             var option={
48                  title : {
49                         text: '合计比重图',
50                         x:'left'
51                     },
52                     tooltip : {
53                         trigger: 'item',
54                         formatter: "{a} <br/>{b} : {c} ({d}%)"
55                     },
56                     legend: {
57                         orient: 'vertical',
58                         x : 'right',
59                         y : 'center',
60                         data: departmentName
61                     },
62                     series : [
63                         {
64                             name: '访问来源',
65                             type: 'pie',
66                             radius : '60%',
67                             center: ['50%', '60%'],
68                             data: (function(){
69                                 var res = [];
70                                 var len = departmentName.length;
71                                 while (len--) {
72                                 res.push({
73                                    name: departmentName[len],
74                                    value: totaldata[len]
75                                 });
76                                 }
77                                 return res;
78                             })(),
79                             itemStyle: {
80                                 emphasis: {
81                                     shadowBlur: 10,
82                                     shadowOffsetX: 0,
83                                     shadowColor: 'rgba(0, 0, 0, 0.5)'
84                                 }
85                             }
86                         }
87                     ]
88             }
89             myChart.setOption(option);
90         }
91       );
92    }
93  </script>
94 </html>
说明: 其中的ajax请求是通过java代码获取数据库的相关数据,获取数据的相关代码如下:
4.获取数据后,通过JSON对象转换,传到前端页面,前端页面根据JSONl来获取对应的数据。
 1 // 绘图逻辑
 2     public void getparams() {
 3         Map<String, String> params = getParams_();
 4         List echartList = dao.queryForList("fee.businessMarketFee.getEchartList", params);
 5         format(echartList);
 6     }
 7
 8     private void format(List list) {
 9         List<String> departName = new ArrayList<String>();
10         List totalfei = new ArrayList<>();
11         List khjlfei = new ArrayList<>();
12         List scxsfei = new ArrayList<>();
13         List ywzdfei = new ArrayList<>();
14         List ywzsfei = new ArrayList<>();
15         List ywylfei = new ArrayList<>();
16         List ywypfei = new ArrayList<>();
17         List ywzdqtfei = new ArrayList<>();
18         List ywspfei = new ArrayList<>();
19         List ywjtfei = new ArrayList<>();
20         List xsctzfei = new ArrayList<>();
21         List schyfei = new ArrayList<>();
22         // ---循环大法
23         for (int i = 0; i < list.size(); i++) {
24             Map map = (Map) list.get(i);
25             departName.add((String) map.get("DEPT_NAME"));
26             totalfei.add(map.get("TOTALFEI"));
27             khjlfei.add(map.get("KHJLFEI"));
28             scxsfei.add(map.get("SCXSFEI"));
29             ywzdfei.add(map.get("YWZDFEI"));
30             ywzsfei.add(map.get("YWZSFEI"));
31             ywylfei.add(map.get("YWYLFEI"));
32             ywypfei.add(map.get("YWYPFEI"));
33             ywzdqtfei.add(map.get("YWZDQTFEI"));
34             ywspfei.add(map.get("YWSPFEI"));
35             ywjtfei.add(map.get("YWJTFEI"));
36             xsctzfei.add(map.get("XSCTZFEI"));
37             schyfei.add(map.get("SCHYFEI"));
38         }
39         doEchart(departName, totalfei, khjlfei, scxsfei, ywzdfei, ywzsfei, ywylfei, ywypfei, ywzdqtfei, ywspfei,
40                 ywjtfei, xsctzfei, schyfei);
41     }
42
43     private void doEchart(List<String> departName, List totalfei, List khjlfei, List scxsfei, List ywzdfei,
44             List ywzsfei, List ywylfei, List ywypfei, List ywzdqtfei, List ywspfei, List ywjtfei, List xsctzfei,
45             List schyfei) {
46         Map<String, List> params = new TreeMap<String, List>();
47         params.put("departName", departName);
48         params.put("totalfei", totalfei);
49         params.put("khjlfei", khjlfei);
50         params.put("scxsfei", scxsfei);
51         params.put("ywzdfei", ywzdfei);
52         params.put("ywzsfei", ywzsfei);
53         params.put("ywylfei", ywylfei);
54         params.put("ywypfei", ywypfei);
55         params.put("ywzdqtfei", ywzdqtfei);
56         params.put("ywspfei", ywspfei);
57         params.put("ywjtfei", ywjtfei);
58         params.put("xsctzfei", xsctzfei);
59         params.put("schyfei", schyfei);
60         setEchart(params);
61     }
62
63     private void setEchart(Map<String, List> params) {
64         HttpServletResponse response = ServletActionContext.getResponse();
65         response.setContentType("text/json; charset=utf-8");
66         JSONObject json = new JSONObject();
67         json.putAll(params);
68         PrintWriter p = null;
69         try {
70             p = response.getWriter();
71             p.println(json.toString());
72         } catch (IOException e) {
73             e.printStackTrace();
74         } finally {
75             p.close();
76         }
77
78     }
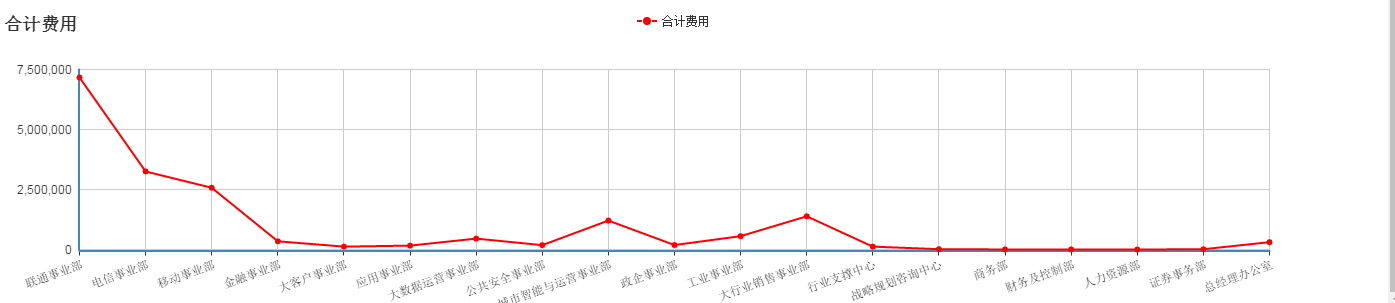
5.折线图的相关代码:(java代码就是上面的代码,只放html代码):
  1 <!DOCTYPE html>
  2 <%@ page contentType="text/html;charset=UTF-8" language="java"%>
  3 <%@ taglib prefix="b" uri="/bonc-tags"%>
  4 <%String contextPath = request.getContextPath();%>
  5 <html>
  6 <head>
  7   <meta http-equiv="Content-Type" content="text/html; charset=utf-8" />
  8
  9 </head>
 10 <body>
 11 </body>
 12  <script type="text/javascript">
 13    function meth1(){
 14        //获取参数
 15        var o1=$("#acctmonth").val();
 16        var departmentName;
 17        var totaldata;
 18        $.ajax({
 19             url:'BusinessMarketFee!getparams.action',
 20             data:{acctmonth:o1},
 21             async:false,
 22             success:function(data){
 23                 departmentName=data.departName;
 24                 totaldata=data.totalfei;
 25             }
 26         });
 27        //alert(totaldata);
 28        if(departmentName==null||departmentName==""){
 29            departmentName=['暂无数据']
 30        }
 31        require.config({
 32               paths: {
 33                 echarts: '<%=contextPath%>/resources/echarts'
 34               }
 35             });
 36        require(
 37         [
 38          'echarts',
 39          'echarts/chart/line',
 40          'echarts/chart/bar'
 41         ],
 42         function DrawEchart(ec){
 43             //图表渲染的容器对象
 44             //加载图表
 45             var myChart=ec.init(document.getElementById("meth1"));
 46             var option={
 47                     title: {
 48                          text: '合计费用'
 49                      },
 50                      tooltip: {
 51                          trigger: 'axis'
 52                      },
 53                      legend: {
 54                          data:['合计费用']
 55                      },
 56                      grid: {
 57                          left: '3%',
 58                          right: '4%',
 59                          bottom: '3%',
 60                          containLabel: true
 61                      },
 62                      toolbox: {
 63                          feature: {
 64                              saveAsImage: {}
 65                          }
 66                      },
 67                      xAxis: {
 68                          type: 'category',
 69                          boundaryGap: false,
 70                          data: departmentName,
 71                          axisLabel :{interval:0,rotate:20,
 72                                 textStyle : {
 73                                    color : '#000',
 74                                    margin: 2
 75                                 }
 76                            }
 77                      },
 78                      yAxis: {
 79                          type: 'value'
 80                      },
 81                      series: [
 82                          {
 83                              name:'合计费用',
 84                              type:'line',
 85                              data: totaldata,
 86                              itemStyle:{
 87                                  normal:{
 88                                      color:function(params){
 89                                          var colorList=['red'];
 90                                          return colorList[0];
 91                                      }
 92                                  }
 93                              }
 94                          }
 95                      ]
 96             };
 97             myChart.setOption(option);
 98         }
 99       );
100    }
101  </script>
102 </html>
6.绘图如下
饼图:
折线图: