比较重要的是:
plt.plot(x, y, "c*-", ...)其中的"c*-"的 c 表示 cyan 是点的颜色,* 表示五角星 是点的形状,- 表示实线 是线的类型。
plt.legend() 表示显示各组点线的 label。
import numpy as np
import matplotlib.pyplot as plt
sd_Np=[2,4,6]
pf_Np=[2,4,6,8,10]
sdg7h11_Np=[2,4,6,8,10,12,14,16]
sd_t_iter=np.log([14,15,17])
pf_t_iter=np.log([136,144,155,172,202])
sdg7h11_t_iter=np.log([1700,1600,1710,1840,2000,2300,2600,3000])
plt.plot(sd_Np,sd_t_iter, "c*-", label="sd shell")
plt.plot(pf_Np,pf_t_iter, "gv-", label="pf shell")
plt.plot(sdg7h11_Np,sdg7h11_t_iter, "ro-", label="sdg7h11 shell")
plt.xlabel("Valence proton number $N_p$, with $N_n = N_p$",fontsize=14)
plt.ylabel("ln $t_{iter}$ (s)", fontsize=15)
plt.legend()
#plt.title("Timing for one iteration in the conjugate gradient method.",fontsize=14)
plt.savefig("t_iter.jpg")
#print(np.log(12), np.log(20), np.log(32))
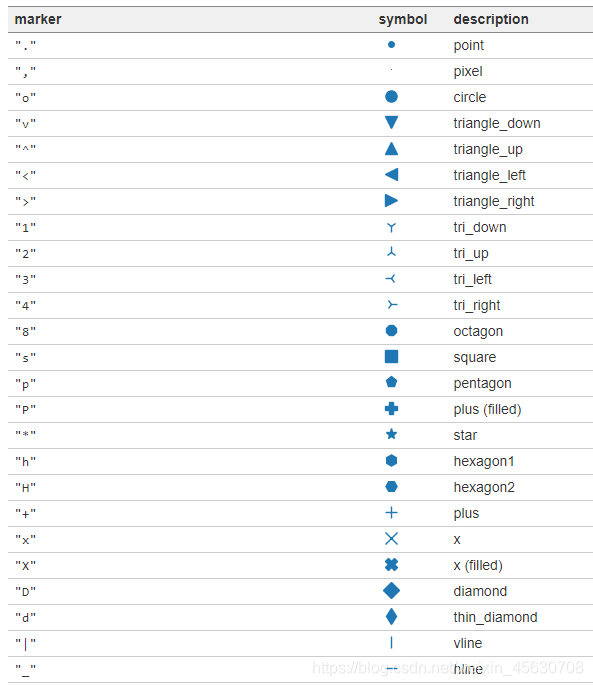
以下是 marker 类型: