numpy.loadtxt 可以载入 txt 数据。
matplotlib.pyplot.scatter 可以画散点图
matplotlib.pyplot.quiver 可以画箭头
matplotlib.pyplot.xlabel, matplot.pyplot.ylabel 可以增加 x, y 轴图例
matplotlib.pyplot.text 可以插入文本
matplotlib.pyplot.savefig 可以保存为 jpg 文件
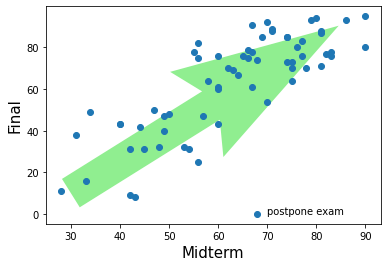
示例代码和效果图片如下
import numpy as np
import matplotlib.pyplot as plt
data = np.loadtxt("../../homework+exam+thesis/mathphys/2021/期中期末.txt")
a = data[:,0] # the 1st column
b = data[:,1] # the 2nd column
plt.xlabel("Midterm",fontsize=15)
plt.ylabel("Final",fontsize=15)
plt.quiver([30],[10], [1.6],[1],width=0.1,scale=2,color="lightgreen") # 起点为(30,10),方向为 (1.6,1),宽度为0.1,长度参数为2,颜色为淡绿色
plt.text(70,0,"postpone exam")
plt.scatter(a,b)
plt.savefig("期末-期中成绩相关性.jpg")