什么是ELK?
通俗来讲,ELK是由Elasticsearch、Logstash、Kibana三个开源软件组成的一个组合体,这三个软件当中,每个软件用于完成不同的功能,ELK又称为ELK stack,官方域名为static.co,ELK-stack的主要优点有如下几个:
处理方式灵活:elasticsearch是实时全文索引,具有强大的搜索功能。
配置相对简单:elasticsearch全部使用JSON接口,logstash使用模板配置,kibana的配置文件部分更简单。
检索性能高效:基于优秀的设计,虽然每次查询都是实时,但是也可以达到百亿级数据的查询秒级响应。
集群线性扩展:elasticsearch和logstash都可以灵活线性扩展。
前端操作绚丽:kibana的前端设计比较绚丽,而且操作简单。
什么是Elasticsearch:
是一个高度可扩展的开源全文搜索和分析引擎,它可实现数据的实时全文搜索、支持分布式可实现高可用、提供API接口,可以处理大规模日志数据,比如Nginx、Tomcat、系统日志等功能。
什么是Logstash:
可以通过插件实现日志收集和转发,支持日志过滤,支持普通log、自定义json格式的日志解析。
什么是Kibana:
主要是通过接口调用elasticsearch的数据,并进行前端数据可视化的展现。
Beats 比 logstash 更轻量级,不需要装java环境。
1. elasticsearch 部署
环境初始化
最小化安装 Centos-7.2-x86_64操作系统的虚拟机,vcpu-2,内存4G或更多,操作系统盘50G,主机名设置规则
为linux-hostX.example.com,其中host1和host2为elasticsearch服务器,为保证效果特额外添加一块单独的
数据磁盘大小为50G并格式化挂载到/data。
1.1 主机名和磁盘挂载
# 修改主机名
hostnamectl set-hostname linux-hostx.example.com && rebbot
hostnamectl set-hostname linux-host2.example.com && rebbot

# 磁盘挂载
mkdir /data
mkfs.xfs /dev/sdb
blkid /dev/sdb
/dev/sdb: UUID="bb780805-efed-43ff-84cb-a0c59c6f4ef9" TYPE="xfs"

vim /etc/fstab
UUID="bb780805-efed-43ff-84cb-a0c59c6f4ef9" /data xfs   defaults        0 0
mount -a

# 各服务器配置本地域名解析
vim /etc/hosts
192.168.182.137 linux-host1.example.com
192.168.182.138 linux-host2.example.com
1.2 关闭防火墙和SELinux,调整文件描述符
1.3 设置epel源、安装基本操作命令并同步时间
yum install -y net-tools vim lrzsz tree screen lsof tcpdump wget ntpdate
cp /usr/share/zoneinfo/Asia/Shanghai /etc/localtime
# 添加计划任务
echo "*/5 * * * * ntpdate time1.aliyun.com &>/dev/null && hwclock-w" >> /var/spool/cron/root
systemctl restart crond
1.4 安装elasticsearch
在host1和host2分别安装elasticsearch
在两台服务器准备java环境:
方式一:直接使用yum安装openjdk
yum install java-1.8.0*
方式二:本地安装在oracle官网下载rpm安装包
yum localinstall jdk-8u92-linux-x64.rpm
方式三:下载二进制包自定义profile环境变量
tar xvf jdk-8u121-linux-x64.tar.gz -C /usr/local/
ln -sv /usr/local/jdk-8u121-linux-x64 /usr/local/jdk
vim /etc/profile

java -version
安装elasticsearch
yum install jdk-8u121-linux-x64.rpm elasticsearch-5.4.0.rpm
1.5 配置elasticsearch
grep  "^[a-Z]" /etc/elasticsearch/elasticsearch.yml
cluster.name: elk-cluster
node.name: elk-node1
path.data: /data/elkdata
path.logs: /data/logs
bootstrap.memory_lock: true
network.host: 192.168.152.138
http.port: 9200
discovery.zen.ping.unicast.hosts: ["192.168.152.138", "192.168.152.139"]
另外一个节点,只需要更改节点名称和监听地址即可:
grep  "^[a-Z]" /etc/elasticsearch/elasticsearch.yml
cluster.name: elk-cluster
node.name: elk-node2
path.data: /data/elkdata
path.logs: /data/logs
bootstrap.memory_lock: true
network.host: 192.168.152.139
http.port: 9200
discovery.zen.ping.unicast.hosts: ["192.168.152.138", "192.168.152.139"]
创建数据和日志目录并授权:
mkdir /data/elkdata
mkdir /data/logs
chown -R elasticsearch.elasticsearch /data/
在启动脚本中修改,开启内存锁定参数:
vim /usr/lib/systemd/system/elasticsearch.service
LimitMEMLOCK=infinity
注意:不开启内存锁定参数,会因为 bootstrap.memory_lock: true 这个参数而启不来。
调整内存大小,默认是2g:
vim /etc/elasticsearch/jvm.options
-Xms2g
-Xmx2g
注意:
将Xmx设置为不超过物理RAM的50%,以确保有足够的物理RAM留给内核文件系统缓存。
elasticsearch内存最高不要超过32G。
https://www.elastic.co/guide/en/elasticsearch/reference/current/heap-size.html
启动服务:
systemctl restart elasticsearch.service
systemctl enable elasticsearch.service
# 检查状态
curl -sXGET http://192.168.152.139:9200/_cluster/health?pretty=true
2.elasticsearch插件之head部署
插件是为了完成不同的功能,官方提供了一些插件但大部分是收费的,另外也有一些开发爱好者提供的插件,可以实现对elasticsearch集群的状态监控与管理配置等功能。
在elasticsearch5.x版本以后不再支持直接安装head插件,而是需要通过启动一个服务方式,git地址:https://github.com/mobz/elasticsearch-head
# NPM 的全称是Node-Package Manager,是随同NodeJS一起安装的包管理和分发工具,它很方便让JavaScript开发者下载、安装、上传以及管理以及安装的包。
安装部署:
cd /usr/local/src
git clone git://github.com/mobz/elasticsearch-head.git
cd elasticsearch-head/
yum install npm -y
npm install grunt -save
ll node_modules/grunt # 确认生成文件
npm install # 执行安装
npm run start & 后台启动服务
修改elasticsearch服务配置文件:
开启跨域访问支持,然后重启elasticsearch服务
vim /etc/elasticsearch/elasticsearch.yml
http.cors.enabled: true #最下方添加
http.cors.allow-origin: "*"
重启服务:
systemctl restart elasticsearch
systemctl enable elasticsearch
粗得是主分片,其他的是副分片是细的 用于备份。
2.1 docker 版本启动head插件
安装docker:
yum install docker -y
systemctl start docker && systemctl enable docker
下载镜像:
docker run -p 9100:9100 mobz/elasticsearch-head:5
如果已有镜像,则导入镜像:
# docker load < elasticsearch-head-docker.tar.gz
查看镜像:
docker images
启动镜像:
docker run -d -p 9100:9100 docker.io/mobz/elasticsearch-head:5
监控脚本:
vim els-cluster-monitor.py
#!/usr/bin/env python
#coding:utf-8

import smtplib
from email.mime.text import MIMEText
from email.utils import formataddr
import subprocess
body=""
false="false"
obj=subprocess.Popen(("curl -sXGET http://192.168.152.139:9200/_cluster/health?pretty=true"),shell=True,stdout=subprocess.PIPE)
data=obj.stdout.read()
data1=eval(data)
status = data1.get("status")
if status == "green":
    print "50"
else:
    print "100"
注意:
如果通过head做数据浏览,
/var/lib/docker/overlay2/840b5e6d4ef64ecfdccfad5aa6d061a43f0efb10dfdff245033e90ce9b524f06/diff/usr/src/app/_site/vendor.js
/var/lib/docker/overlay2/048d9106359b9e263e74246c56193a5852db6a5b99e4a0f9dd438e657ced78d3/diff/usr/src/app/_site/vendor.js

更改application/x-www-form-urlencoded 为 application/json
3.logstash部署
logstash环境准备及安装:
Logstash是一个开源的数据收集引擎,可以水平伸缩,而且logstash整个ELK当中拥有最多插件的一个组件,其可以接收来自不同来源的数据并统一输出到指定的且可以是多个不同目的地。
环境准备:
关闭防火墙和selinux,并且安装java环境
sed -i '/SELINUX/s/enforcing/disabled/' /etc/selinux/config
yum install jdk-8u121-linux-x64.rpm
安装logstash:
yum install logstash-5.3.0.rpm -y
# 权限更改为logstash用户和组,否则启动的时候日志报错
chown logstash.logstash /usr/share/logstash/data/queue -R
测试logstash:
测试标准输入和输出:
/usr/share/logstash/bin/logstash -e 'input{ stdin{} } output{stdout{ codec=>rubydebug}}' #标准输入和输出
hello
{
    "@timestamp" => 2017-11-18T13:49:41.425Z,	#当前事件的发生时间,
      "@version" => "1",	#事件版本号,一个事件就是一个ruby对象
          "host" => "linux-host2.example.com",	#标记事件发生在哪里
       "message" => "hello"		#消息的具体内容
}

# 时间不用管它,浏览器会帮我们转换得。
# 压缩文件
/usr/share/logstash/bin/logstash -e 'input{ stdin{} } output{file{path=>"/tmp/test-%{+YYYY.MM.dd}.log.tar.gz" gzip=>true}}'
# 测试输出到elasticsearch
/usr/share/logstash/bin/logstash -e 'input{ stdin{} } output{ elasticsearch {hosts => ["192.168.152.138:9200"] index => "logstash-test-%{+YYYY.MM.dd}"}}'
# 索引存放位置
ll /data/elkdata/nodes/0/indices/
total 0
drwxr-xr-x. 8 elasticsearch elasticsearch 65 Nov 18 20:17 W8VO0wNfTDy9h37CYpu17g
# 删除索引有两种方式:
一种是elasticsearch,一种是通过api
logstash配置文件之收集系统日志:
# 配置文件说明:conf结尾,名字自定义,一个配置文件可以收集多个日志
vim /etc/logstash/conf.d/system.conf
input {
file {
   path => "/var/log/messages"
   type => "systemlog"		# 日志类型
   start_position => "beginning"	#第一次从头收集,之后从新添加的日志收集
   stat_interval => "2"		# 多长时间去收集一次,两秒
 }
}

output {
   elasticsearch {	# 定义插件名称
    hosts => ["192.168.152.138:9200"]
    index => "logstash-systemlog-%{+YYYY.MM.dd}"	# 为什么要加logstash,主要是后期再地图上显示客户端显示城市,模板上必须要以logstash开头
  }
}
更改/var/log/messages权限:
# 由于logstash对message没有读得权限
chmod 644 /var/log/messages
检查配置文件是否有报错:
# /usr/share/logstash/bin/logstash -f /etc/logstash/conf.d/system.conf -t
WARNING: Could not find logstash.yml which is typically located in $LS_HOME/config or /etc/logstash. You can specify the path using --path.settings. Continuing using the defaults
Could not find log4j2 configuration at path /usr/share/logstash/config/log4j2.properties. Using default config which logs to console
Configuration OK
15:43:39.440 [LogStash::Runner] INFO  logstash.runner - Using config.test_and_exit mode. Config Validation Result: OK. Exiting Logstash
# 启动服务:
systemctl restart logstash
# 启动成功后,显示logstash-systemlog:

# 添加到kibana:
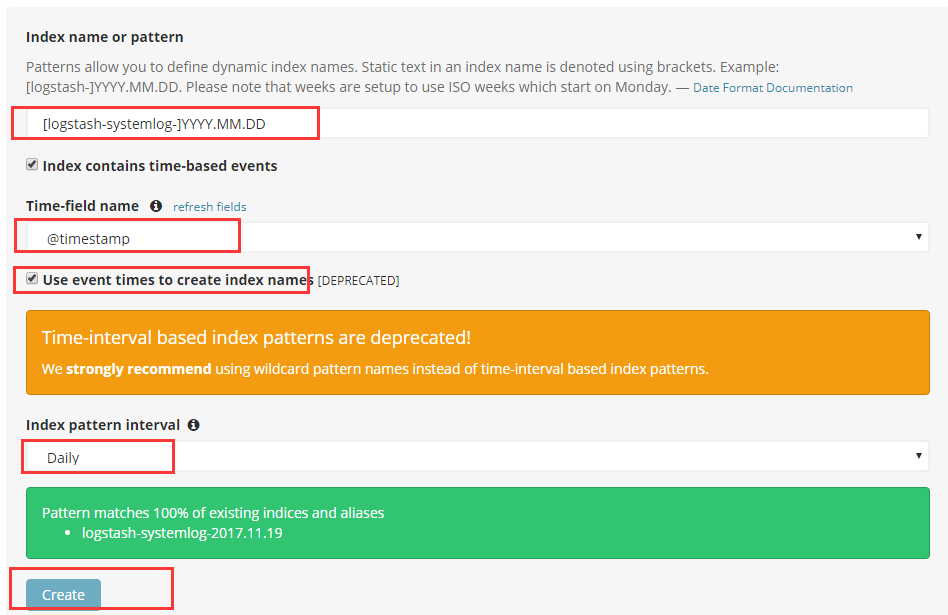
4.kibana部署
kibana可以单独安装到一台服务器
yum install kibana-5.4.0-x86_64.rpm -y

更改配置文件:
grep "^[a-Z]" /etc/kibana/kibana.yml
server.port: 5601	#端口
server.host: "192.168.152.138"	#监听地址
elasticsearch.url: "http://192.168.152.139:9200"	#URL地址

# 查看kibana状态
http://192.168.152.138:5601/status

# 启动kibana
systemctl restart kibana
systemctl enable kibana
# kibana 匹配:
[logstash-test]-YYYY.MM.DD
# 显示

5. if判断多个type类型
cat /etc/logstash/conf.d/system.conf
input {
file {
   path => "/var/log/messages"
   type => "systemlog"
   start_position => "beginning"
   stat_interval => "2"
 }


file {
   path => "/var/log/lastlog"
   type => "system-last"
   start_position => "beginning"
   stat_interval => "2"
}}

output {
   if [type] == "systemlog"{
   elasticsearch {
    hosts => ["192.168.152.138:9200"]
    index => "logstash-systemlog-%{+YYYY.MM.dd}"
  }
   file{
    path => "/tmp/last.log"
 }}
  if [type] == "system-last" {
   elasticsearch {
    hosts => ["192.168.152.138:9200"]
    index => "logstash-lastmlog-%{+YYYY.MM.dd}"
 }}
}

# 检查配置是否正确
/usr/share/logstash/bin/logstash -f /etc/logstash/conf.d/system.conf -t
# 重启服务
systemctl restart logstash
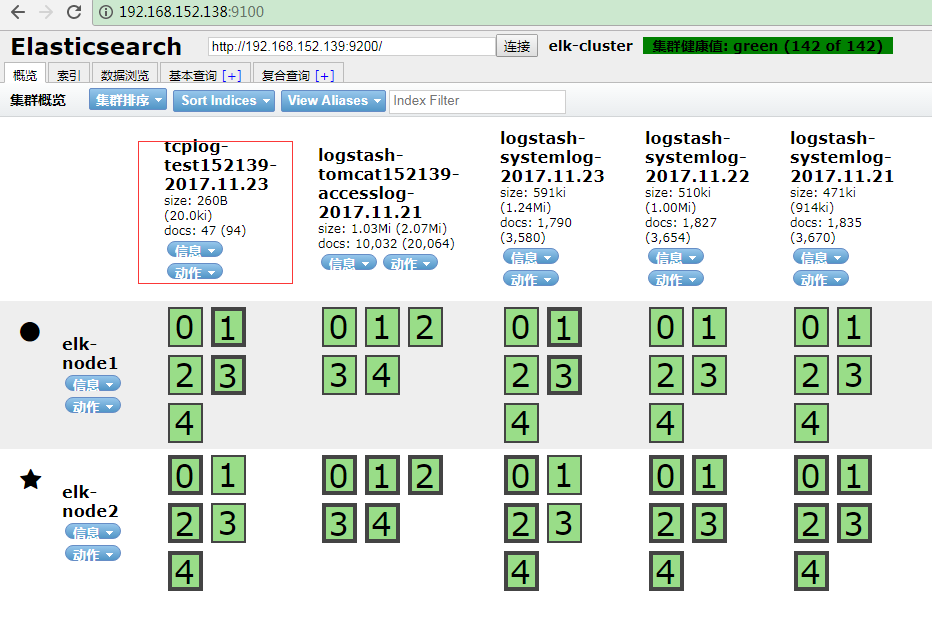
在elastic-head查看节点:

添加到kibana:
6.收集nginx访问日志
部署nginx服务:
编辑配置文件并准备web页面:
# 添加到nginx.conf
vim conf/nginx.conf

# 添加json格式的日志
log_format access_json '{"@timestamp":"$time_iso8601",'
        '"host":"$server_addr",'
        '"clientip":"$remote_addr",'
        '"size":$body_bytes_sent,'
        '"responsetime":$request_time,'
        '"upstreamtime":"$upstream_response_time",'
        '"upstreamhost":"$upstream_addr",'
        '"http_host":"$host",'
        '"url":"$uri",'
        '"domain":"$host",'
        '"xff":"$http_x_forwarded_for",'
        '"referer":"$http_referer",'
        '"status":"$status"}';
access_log  /var/log/nginx/access.log access_json;

# 添加站点
location /web{
    root html;
    index index.html index.htm;
}

# 创建目录
mkdir /usr/local/nginx/html/web

# 首页文件
echo 'Nginx webPage!' > /usr/local/nginx/html/web/index.html

# 不stop,日志格式会乱
/usr/local/nginx/sbin/nginx -s stop

# 授权
chown nginx.nginx /var/log/nginx

# 启动
/usr/local/nginx/sbin/nginx

# 查看访问日志
[root@linux-host2 conf]# tail -f /var/log/nginx/access.log
{"@timestamp":"2017-11-20T23:51:00+08:00","host":"192.168.152.139","clientip":"192.168.152.1","size":0,"responsetime":0.000,"upstreamtime":"-","upstreamhost":"-","http_host":"192.168.152.139","url":"/web/index.html","domain":"192.168.152.139","xff":"-","referer":"-","status":"304"}
模拟访问:
# 模拟多个访问
yum install httpd-tools -y
# 一千个请求,每次处理100个,共10次处理完。
ab -n1000 -c100 http://192.168.152.139/web/index.html
添加logstash配置:
vim /etc/logstash/conf.d/nginx-accesslog.conf
input {
   file {
     path => "/var/log/nginx/access.log"
     type => "nginx-access-log"
     start_position => "beginning"
     stat_interval => "2"
   }
}

output {
   elasticsearch {
     hosts => ["192.168.152.139:9200"]
     index => "logstash-nginx-access-log-%{+YYYY.MM.dd}"
   }
}

# 检查配置文件:
/usr/share/logstash/bin/logstash -f /etc/logstash/conf.d/nginx-accesslog.conf -t

# 重启logstash
systemctl restart logstash
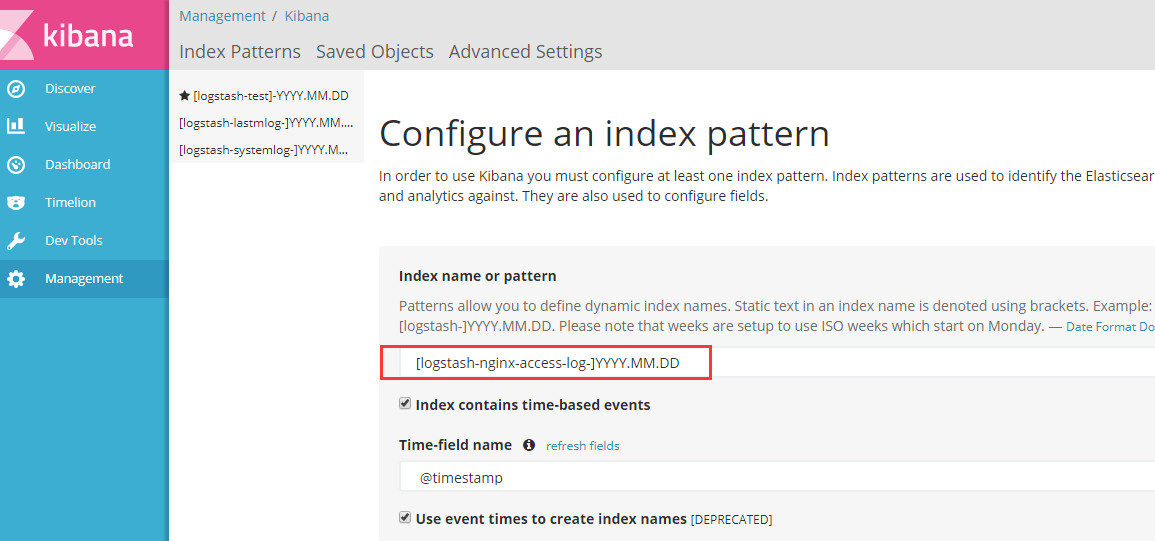
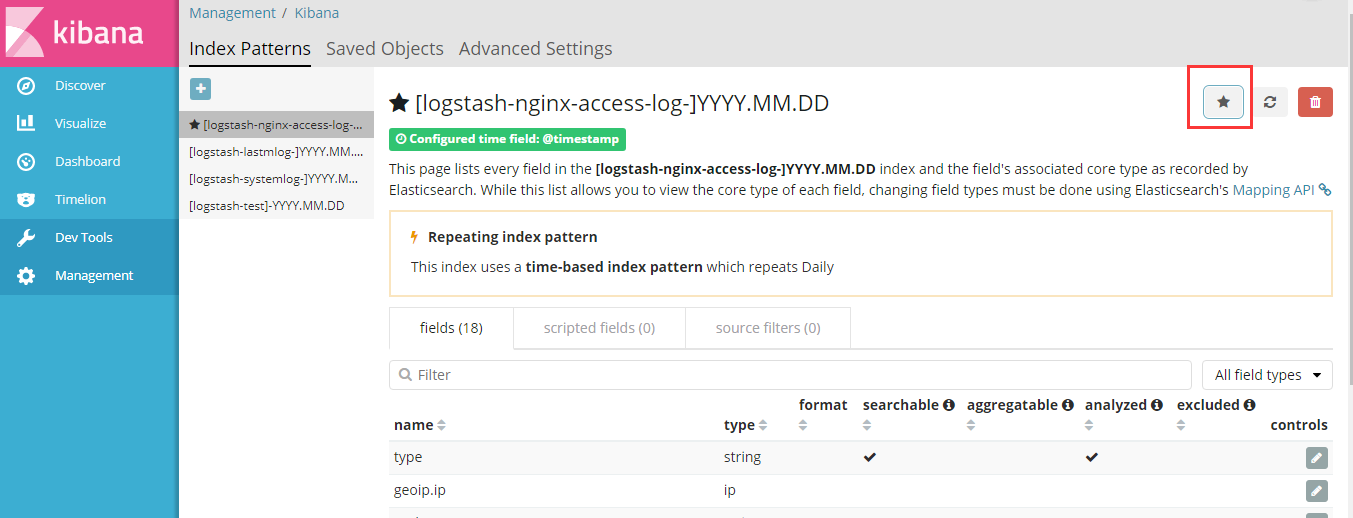
查看是否已添加到es:

添加到kibana:

7.Tomcat日志转json并收集
服务器部署tomcat服务:
安装java环境,并自定义一个web界面进行测试。
配置java环境并部署Tomcat:
yum install jdk-8u121-linux-x64.rpm
cd /usr/local/src
[root@linux-host1 src]# tar -xf apache-tomcat-8.0.27.tar.gz
[root@linux-host1 src]# cp -rf apache-tomcat-8.0.27 /usr/local/
[root@linux-host1 src]# ln -sv /usr/local/apache-tomcat-8.0.27/ /usr/local/tomcat
"/usr/local/tomcat" -> "/usr/local/apache-tomcat-8.0.27/"
[root@linux-host1 webapps]# mkdir /usr/local/tomcat/webapps/webdir
[root@linux-host1 webapps]# echo "Tomcat Page" > /usr/local/tomcat/webapps/webdir/index.html
[root@linux-host1 webapps]# ../bin/catalina.sh start
Using CATALINA_BASE:   /usr/local/tomcat
Using CATALINA_HOME:   /usr/local/tomcat
Using CATALINA_TMPDIR: /usr/local/tomcat/temp
Using JRE_HOME:        /usr
Using CLASSPATH:       /usr/local/tomcat/bin/bootstrap.jar:/usr/local/tomcat/bin/tomcat-juli.jar
Tomcat started.
[root@linux-host1 webapps]# ss -lnt | grep 8080
LISTEN     0      100         :::8080                    :::*
配置tomcat的server.xml配置文件:
[root@linux-host1 conf]# diff server.xml server.xml.bak
136,137c136,137
<                prefix="tomcat_access_log" suffix=".log"
<              pattern="{"clientip":"%h","ClientUser":"%l","authenticated":"%u","AccessTime":"%t","method":"%r","status":"%s","SendBytes":"%b","Query?string":"%q","partner":"%{Refere}i","Agentversion":"%{User-Agent}i"}"/>
---
>                prefix="localhost_access_log" suffix=".txt"
>                pattern="%h %l %u %t "%r" %s %b" />

[root@linux-host1 conf]# ../bin/startup.sh stop
Using CATALINA_BASE:   /usr/local/tomcat
Using CATALINA_HOME:   /usr/local/tomcat
Using CATALINA_TMPDIR: /usr/local/tomcat/temp
Using JRE_HOME:        /usr
Using CLASSPATH:       /usr/local/tomcat/bin/bootstrap.jar:/usr/local/tomcat/bin/tomcat-juli.jar
Tomcat started.
[root@linux-host1 conf]# ../bin/startup.sh start
Using CATALINA_BASE:   /usr/local/tomcat
Using CATALINA_HOME:   /usr/local/tomcat
Using CATALINA_TMPDIR: /usr/local/tomcat/temp
Using JRE_HOME:        /usr
Using CLASSPATH:       /usr/local/tomcat/bin/bootstrap.jar:/usr/local/tomcat/bin/tomcat-juli.jar
Tomcat started.
查看日志:
[root@linux-host1 tomcat]# tail -f logs/tomcat_access_log.2017-11-21.log | jq
{
  "clientip": "192.168.152.1",
  "ClientUser": "-",
  "authenticated": "-",
  "AccessTime": "[21/Nov/2017:23:45:45 +0800]",
  "method": "GET /webdir2/ HTTP/1.1",
  "status": "304",
  "SendBytes": "-",
  "Query?string": "",
  "partner": "-",
  "Agentversion": "Mozilla/5.0 (Windows NT 6.1; Win64; x64) AppleWebKit/537.36 (KHTML, like Gecko) Chrome/60.0.3112.90 Safari/537.36"
}
{
  "clientip": "192.168.152.1",
  "ClientUser": "-",
  "authenticated": "-",
  "AccessTime": "[21/Nov/2017:23:45:45 +0800]",
  "method": "GET /webdir2/ HTTP/1.1",
  "status": "200",
  "SendBytes": "13",
  "Query?string": "",
  "partner": "-",
  "Agentversion": "Mozilla/5.0 (Windows NT 6.1; Win64; x64) AppleWebKit/537.36 (KHTML, like Gecko) Chrome/60.0.3112.90 Safari/537.36"
}
添加logstash配置:
[root@linux-host2 ~]# vim /etc/logstash/conf.d/tomcat_access.conf
input {
   file {
     path => "/usr/local/tomcat/logs/tomcat_access_log.*.log"
     type => "tomcat-accesslog"
     start_position => "beginning"
     stat_interval => "2"
   }
}

output {
   if [type] == "tomcat-accesslog" {
   elasticsearch {
     hosts => ["192.168.152.138:9200"]
     index => "logstash-tomcat152139-accesslog-%{+YYYY.MM.dd}"
   }}
}


# 检查配置文件:
/usr/share/logstash/bin/logstash -f /etc/logstash/conf.d/nginx-accesslog.conf -t
注意:
path => "/usr/local/tomcat/logs/tomcat_access_log.*.log "中一定不要有空格,不然会找不到索引,血得教训。
path日志 * 代表匹配所有日志,如果需要直观定位哪台机器的索引,可以添加后两位的ip地址。
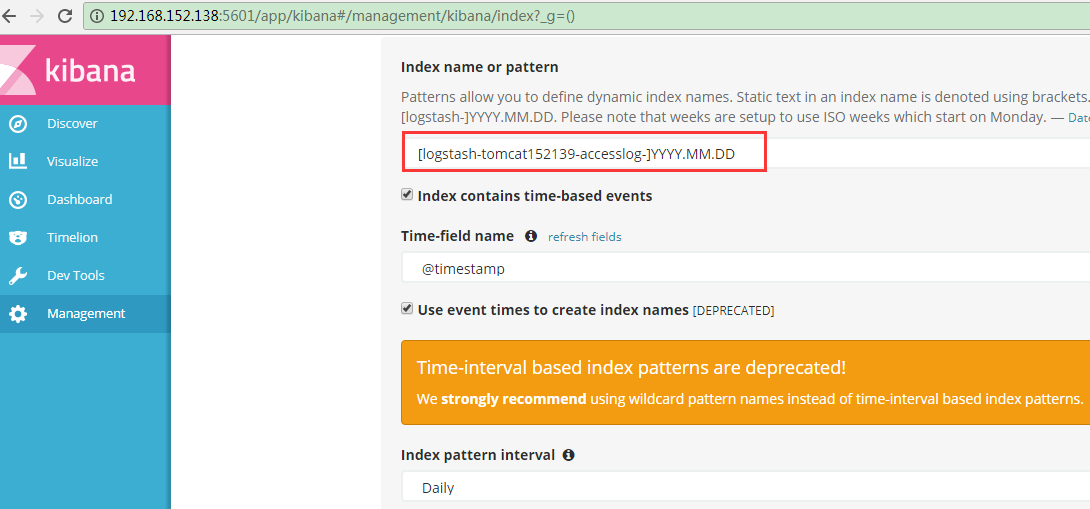
查看es:

添加到kiban:
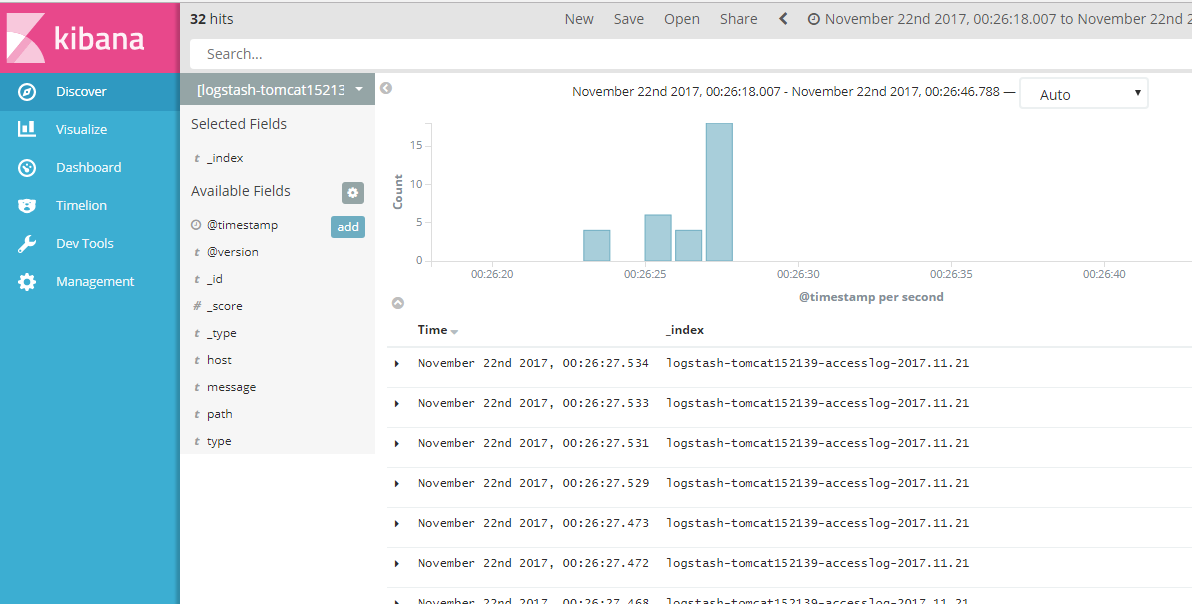
测试并发:
[root@linux-host2 tomcat]# ab -n10000 -c100 http://192.168.152.139:8080/webdir/index.html
This is ApacheBench, Version 2.3 <$Revision: 1430300 $>
Copyright 1996 Adam Twiss, Zeus Technology Ltd, http://www.zeustech.net/
Licensed to The Apache Software Foundation, http://www.apache.org/

Benchmarking 192.168.152.139 (be patient)
Completed 1000 requests
Completed 2000 requests
Completed 3000 requests
Completed 4000 requests
Completed 5000 requests
Completed 6000 requests
Completed 7000 requests
Completed 8000 requests
Completed 9000 requests
Completed 10000 requests
Finished 10000 requests


Server Software:        Apache-Coyote/1.1
Server Hostname:        192.168.152.139
Server Port:            8080

Document Path:          /webdir/index.html
Document Length:        12 bytes

Concurrency Level:      100
Time taken for tests:   17.607 seconds
Complete requests:      10000
Failed requests:        0
Write errors:           0
Total transferred:      2550000 bytes
HTML transferred:       120000 bytes
Requests per second:    567.96 [#/sec] (mean)
Time per request:       176.068 [ms] (mean)
Time per request:       1.761 [ms] (mean, across all concurrent requests)
Transfer rate:          141.44 [Kbytes/sec] received

Connection Times (ms)
              min  mean[+/-sd] median   max
Connect:        0   22  24.1     11     158
Processing:    19  154 117.4    116    2218
Waiting:        1  141 113.7     95    2129
Total:         19  175 113.6    142    2226

Percentage of the requests served within a certain time (ms)
  50%    142
  66%    171
  75%    204
  80%    228
  90%    307
  95%    380
  98%    475
  99%    523
 100%   2226 (longest request)
8.收集java日志
使用codec的multiline插件实现多行匹配,这是一个可以将多行进行合并的插件,而且可以使用what指定将匹配到的行与前面的行合并还是和后面的行合并,
https://www.elastic.co/guide/en/logstash/current/plugins-codecs-multiline.html
在elasticsearch服务器部署logstash示例:
chown logstash.logstash /usr/share/logstash/data/queue -R
ll -d /usr/share/logstash/data/queue
cat /etc/logstash/conf.d/java.conf
input{
	stdin{
	codec=>multiline{
	pattern=>"^["	#当遇到[开头的行时候将多行进行合并
	negate=>true #true 为匹配成功进行操作,false为不成功进行操作
	what=>"previous" #与上面的行合并,如果是下面的行合并就是next
	}}
}
filter{ #日志过滤,如果所有的日志都过滤就写这里,如果只针对某一个过滤就写在input里面的日志输入里面
}
output{
	stdout{
	codec=>rubydebug
}}
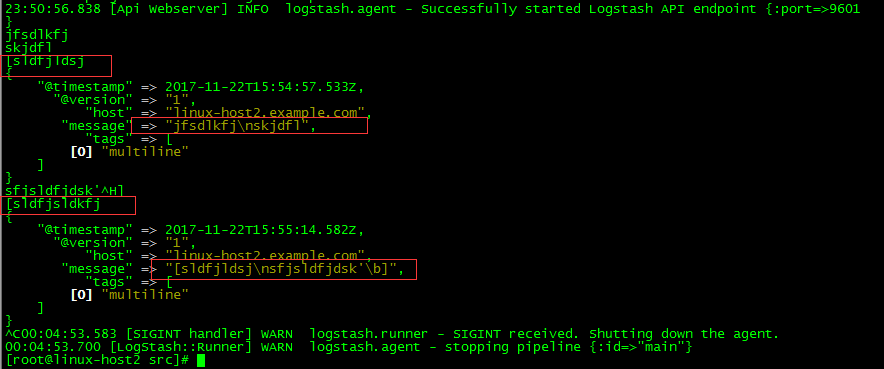
测试匹配代码:
/usr/share/logstash/bin/logstash -e 'input { stdin { codec => multiline { pattern => "^[" negate => true what => "previous" }}} output { stdout { codec => rubydebug}}'
注意:如果匹配空行,使用$
测试匹配输出:
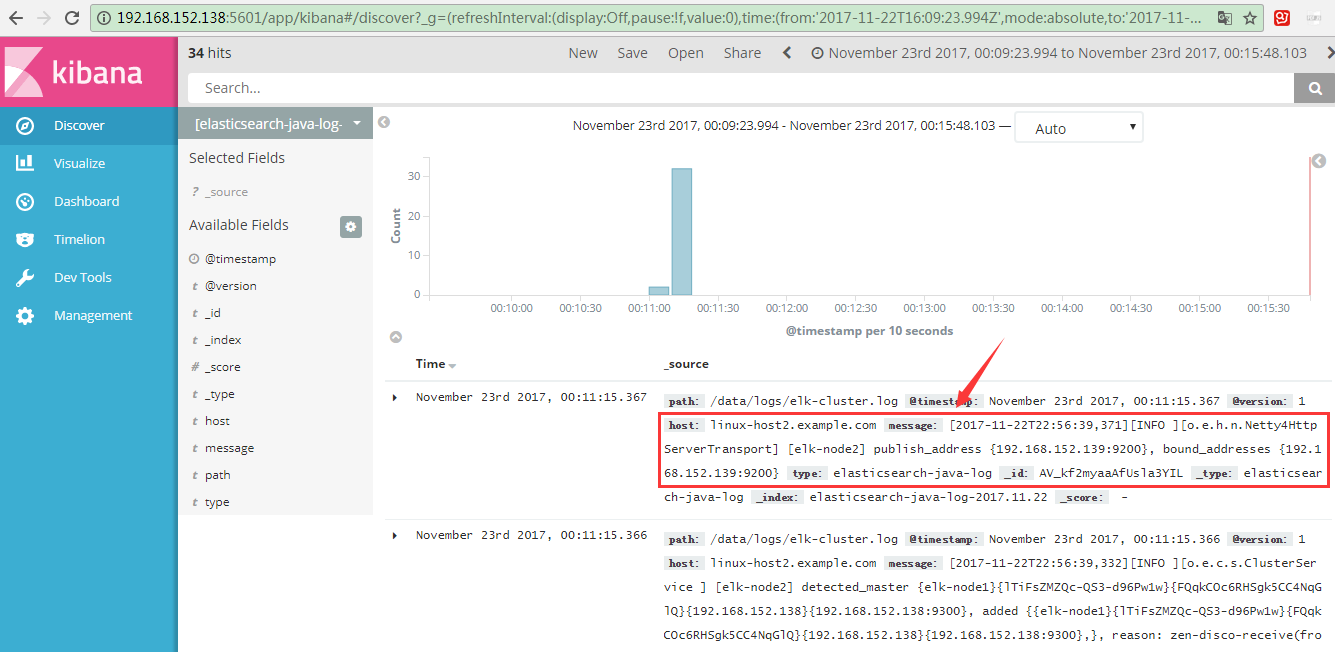
日志格式:
[root@linux-host1 ~]# tail /data/logs/elk-cluster.log
[2017-11-23T00:11:09,559][INFO ][o.e.c.m.MetaDataMappingService] [elk-node1] [logstash-nginx-access-log-2017.11.22/N8AF_HmTSiqBiX7pNulkYw] create_mapping [elasticsearch-java-log]
[2017-11-23T00:11:10,777][INFO ][o.e.c.m.MetaDataCreateIndexService] [elk-node1] [elasticsearch-java-log-2017.11.22] creating index, cause [auto(bulk api)], templates [], shards [5]/[1], mappings []
[2017-11-23T00:11:11,881][INFO ][o.e.c.m.MetaDataMappingService] [elk-node1] [elasticsearch-java-log-2017.11.22/S5LpdLyDRCq3ozqVnJnyBg] create_mapping [elasticsearch-java-log]
[2017-11-23T00:11:12,418][INFO ][o.e.c.r.a.AllocationService] [elk-node1] Cluster health status changed from [YELLOW] to [GREEN] (reason: [shards started [[elasticsearch-java-log-2017.11.22][3]] ...]).
生产配置文件:
vim /etc/logstash/conf.d/java.conf
input {
   file {
     path => "/data/logs/elk-cluster.log"
     type => "elasticsearch-java-log"
     start_position => "beginning"
     stat_interval => "2"
     codec => multiline
     { pattern => "^["
     negate => true
     what => "previous" }
}}

output {
   if [type] == "elasticsearch-java-log" {
   elasticsearch {
     hosts => ["192.168.152.138:9200"]
     index => "elasticsearch-java-log-%{+YYYY.MM.dd}"
   }}
}
验证语法:
/usr/share/logstash/bin/logstash -f /etc/logstash/conf.d/java.conf -t

WARNING: Could not find logstash.yml which is typically located in $LS_HOME/config or /etc/logstash. You can specify the path using --path.settings. Continuing using the defaults
Could not find log4j2 configuration at path /usr/share/logstash/config/log4j2.properties. Using default config which logs to console
Configuration OK
00:06:47.228 [LogStash::Runner] INFO  logstash.runner - Using config.test_and_exit mode. Config Validation Result: OK. Exiting Logstash
重启服务:
systemctl restart logstash
查看es状态:
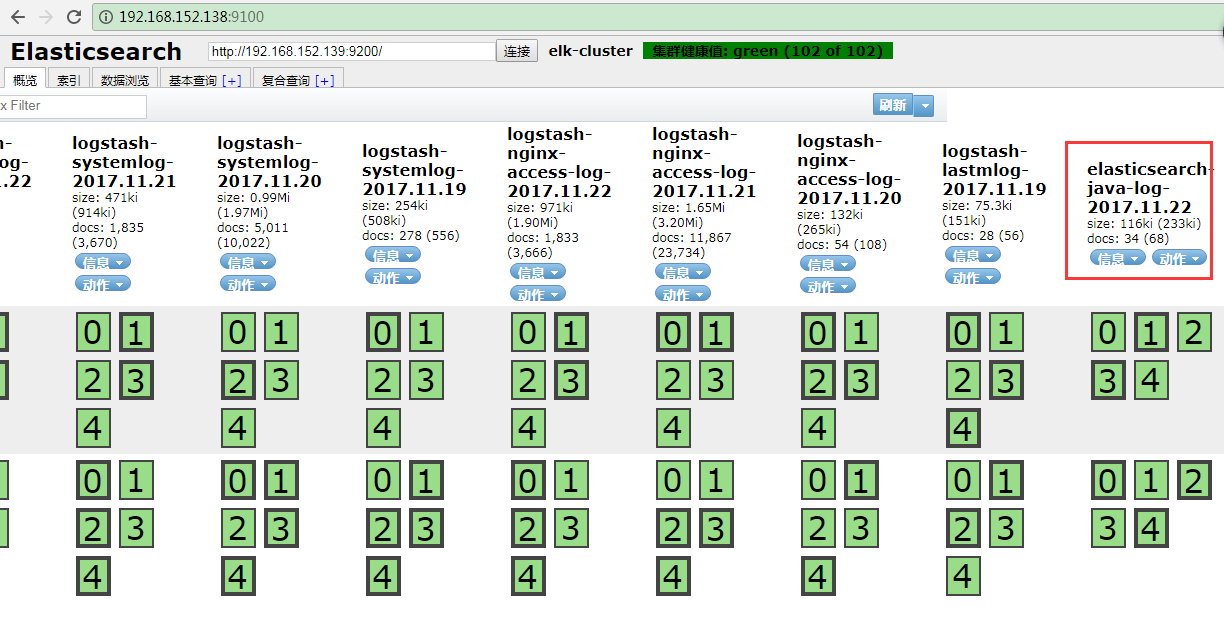
添加到kibana:
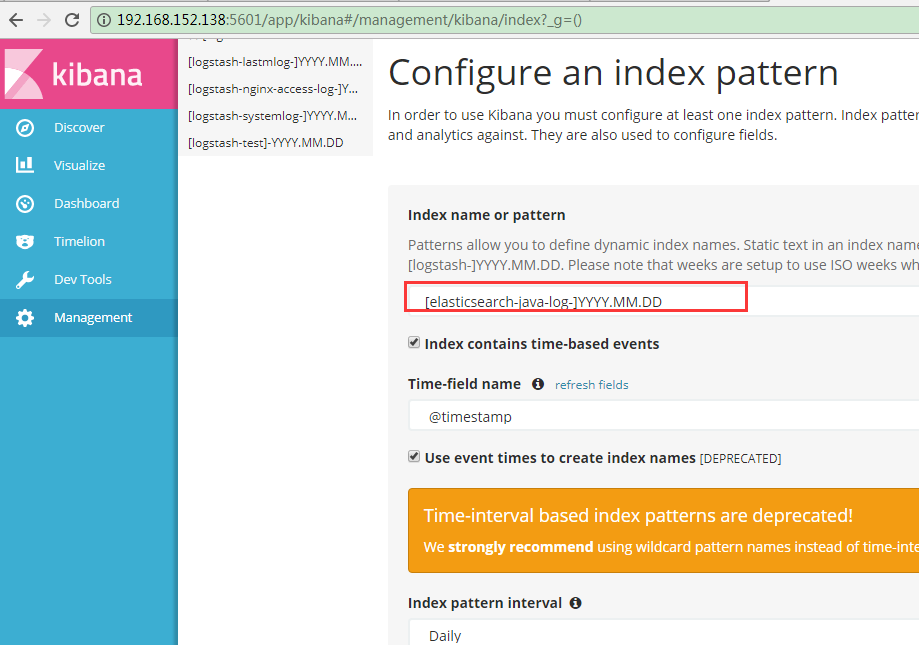
kibana展示:
9.收集TCP日志
如果一些日志丢失,可以通过这种方式来进行了补一些日志。
https://www.elastic.co/guide/en/logstash/current/plugins-inputs-tcp.html
# 测试配置文件
vim /etc/logstash/conf.d/tcp.conf
input {
	tcp {
		port => 5600
		mode => "server"
		type => "tcplog"
	}
}

output {
	stdout {
		codec => rubydebug
	}
}
# 验证配置是否正确语法
/usr/share/logstash/bin/logstash -f /etc/logstash/conf.d/tcp.conf -t
# 启动
/usr/share/logstash/bin/logstash -f /etc/logstash/conf.d/tcp.conf
在其他服务器安装nc命令:
NetCat简称nc,在网络工具中有“瑞士军刀”美誉,其功能实用,是一个简单、可靠的网络工具,可通过TCP或UDP协议传输读写数据,另外还具有很多其他功能。
yum install nc -y
# 发送数据
echo "nc test"|nc 192.168.56.16 9889
验证logstash是否接收到数据:
{
    "@timestamp" => 2017-11-23T15:36:50.938Z,
          "port" => 34082,
      "@version" => "1",
          "host" => "192.168.152.138",
       "message" => "tcpdata",
          "type" => "tcplog"
}
通过nc命令发送一个文件:
nc 192.168.152.139 5600 < /etc/passwd
通过伪设备的方式发送消息:
在类Unix操作系统中,设备节点并不一定要对应物理设备。没有这种对应关系的设备是伪设备。操作系统运用了它们提供的多种功能,tcp只是dev下面众多伪设备当中的一种设备。
echo "伪设备" > /dev/tcp/192.168.152.139/5600
echo "2222" > /dev/tcp/192.168.152.139/5600
生产配置:
vim /etc/logstash/conf.d/tomcat_tcp.conf
input {
   file {
     path => "/usr/local/tomcat/logs/tomcat_access_log.*.log"
     type => "tomcat-accesslog"
     start_position => "beginning"
     stat_interval => "2"
   }
   tcp {
         port => 5600
         mode => "server"
         type => "tcplog"
   }
}

output {
   if [type] == "tomcat-accesslog" {
   elasticsearch {
     hosts => ["192.168.152.138:9200"]
     index => "logstash-tomcat152139-accesslog-%{+YYYY.MM.dd}"
   }}
   if [type] == "tcplog" {
   elasticsearch {
     hosts => ["192.168.152.138:9200"]
     index => "tcplog-test152139-%{+YYYY.MM.dd}"
   }}
}
查看ES:
查看kibana:

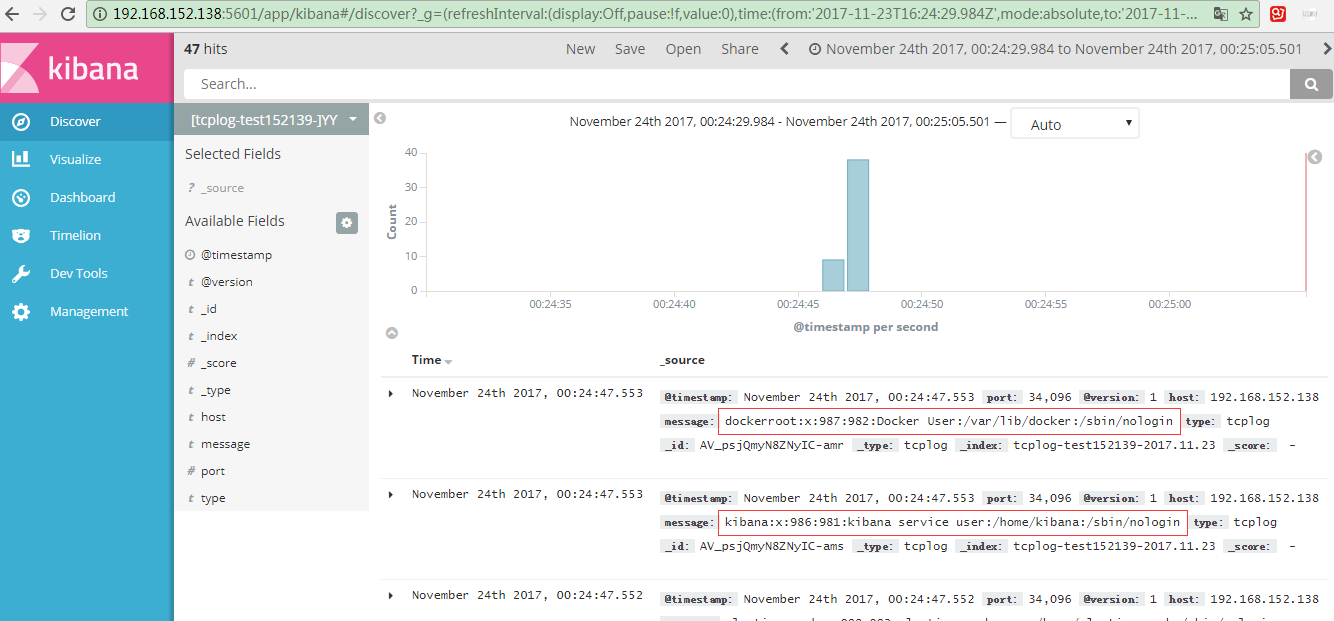
发送数据:

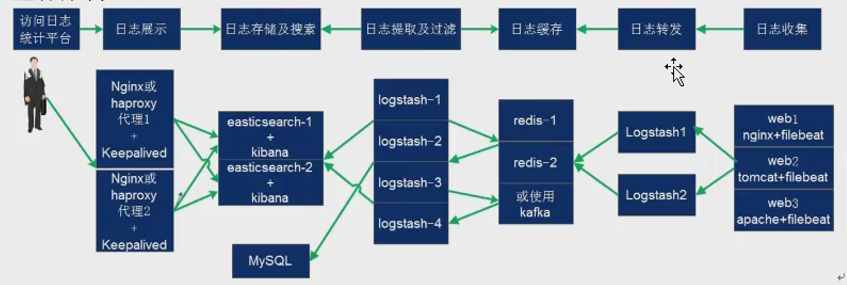
11.架构规划
在下面的图当中从左向右看,当要访问ELK日志统计平台的时候,首先访问的是两天Nginx+keepalived做的负载高可用,访问的地址是keepalived的IP,当一台nginx代理服务器挂掉之后也不影响访问,然后nginx将请求转发到kibana,kibana再去elasticsearch获取数据,elasticsearch是两台做的集群,数据会随机保存在任意一台elasticsearch服务器,redis服务器做数据的临时保存,避免web服务器日志量过大的时候造成的数据收集与保存不一致导致的日志丢失,可以临时保存到redis,redis可以是集群,然后再由logstash服务器在非高峰时期从redis持续的取出即可,另外有一台mysql数据库服务器,用于持久化保存特定的数据,web服务器的日志由filebeat收集之后发送给另外的一台logstash,再有其写入到redis即可完成日志的收集,从图中可以看出,redis服务器处于前端结合的最中间,其左右都要依赖于redis的正常运行,那么我们就先从部署redis开始,然后将日志从web服务器收集到redis,在安装elasticsearch、kibana和从redis提取日志的logstash。
12. logstash收集日志并写入redis
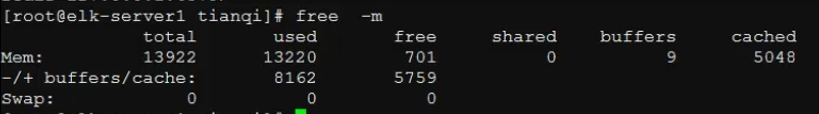
用一台服务器按照部署redis服务,专门用于日志缓存使用,用于web服务器产生大量日志的场景,例如下面的服务器内存即将被使用完毕,查看是因为redis服务保存了大量的数据没有被读取而占用了大量的内存空间。
如果占用内存太多,这时候需要添加logstash服务器了,增加读取速度。
安装并配置redis:
ln -sv /usr/local/src/redis-4.0.6 /usr/local/redis
cp src/redis-server /usr/bin/
cp src/redis-cli /usr/bin/

bind 192.168.152.139
daemonize yes   # 允许后台启动
# 打开save "",save 全部禁止
save ""
#save 900 1
#save 300 10
#save 60 10000
# 开启认证
requirepass 123456

启动:
redis-server /usr/local/redis/redis.conf

测试:
[root@linux-host2 redis-4.0.6]# redis-cli -h 192.168.152.139
192.168.152.139:6379> KEYS *
(error) NOAUTH Authentication required.
192.168.152.139:6379> auth 123456
OK
192.168.152.139:6379> KEYS
(error) ERR wrong number of arguments for 'keys' command
192.168.152.139:6379> KEYS *
(empty list or set)
192.168.152.139:6379>
配置logstash将日志写入至redis:
将tomcat服务器的logstash收集之后的tomcat访问日志写入到redis服务器,然后通过另外的logstash将redis服务器的数据取出再写入elasticsearch服务器。
官方文档:
www.elastic.co/guide/en/logstash/current/plugins-outputs-redis.html
redis-cli -h 192.168.152.139 -a 123456
LLEN rsyslog-5612
LPOP rsyslog-5612 # 弹一条

查看数据:
redis-cli -h 192.168.152.139 -a 123456
#查询数据
SELECT 1
#查看数据
KEYS *
logstash配置:
input {
  redis {
	data_type => "list"
	host => "192.168.152.139"
	db => "1"
	port => "6379"
	key => "rsyslog-5612"
	password => "123456"
  }
}

output {
  elasticsearch {
    hosts => ["192.168.152.139:9200"]
	index => "redis-rsyslog-5612-%{+YYYY.MM.dd}"
  }
}
待补充:
通过rsyslog收集haproxy日志:
在centos 6及之前的版本叫做syslog,centos7开始叫做rsyslog,根据官方的介绍,rsyslog(2013年版本)可以达到每秒转发百万条日志的级别,官方网址http://www.rsyslog.com/,确认系统安装的版本命令如下:

安装:
yum install gcc gcc-c++ pcre pcre-devel openssl openss-devel -y

make TARGET=linux2628 USER_PCRE=1 USE_OPENSSL=1 USE_ZLIB=1 PREFIX=/usr/local/haproxy

make install PREFIX=/usr/local/haproxy

# 查看版本
/usr/local/haproxy/sbin/haproxy -v

准备启动脚本:
vim /usr/lib/systemd/system/haproxy.service
[Unit]
Description=HAProxy Load Balancer
After=syslog.target network.target

[Service]
EnvironmentFile=/etc/sysconfig/haproxy
ExecStart=/usr/sbin/haproxy-systemd-wrapper -f /etc/sysconfig/haproxy.cfg -p /run/haproxy.pid $OPTIONS
ExecReload=/bin/kill -USR2 $MAINPID

[Install]
WantedBy=multi-user.target


[root@linux-host2 haproxy-1.7.9]# cp /usr/local/src/haproxy-1.7.9/haproxy-systemd-wrapper /usr/sbin/
[root@linux-host2 haproxy-1.7.9]# cp /usr/local/src/haproxy-1.7.9/haproxy /usr/sbin/

vim /etc/sysconfig/haproxy #系统级配置文件
OPTIONS=""

mkdir /etc/haproxy

vim /etc/sysconfig/haproxy.cfg
global
maxconn 100000
chroot /usr/local/haproxy
uid 99
gid 99
daemon
nbproc 1
pidfile /usr/local/haproxy/run/haproxy.pid
log 127.0.0.1 local6 info

defaults
option http-keep-alive
option forwardfor
maxconn 100000
mode http
timeout connect 300000ms
timeout client	300000ms
timeout server 	300000ms

listen stats
mode http
bind 0.0.0.0:9999
stats enable
log global
stats uri	/haproxy-status
stats auth 	headmin:123456

#frontend web_port
frontend web_port
	bind 0.0.0.0:80
	mode http
	option httplog
	log global
	option forwardfor

###################ACL Setting###################
	acl pc 			hdr_dom(host) -i www.elk.com
	acl mobile		hdr_dom(host) -i m.elk.com
###################USE ACL ######################
	use_backend		pc_host		if pc
	use_backend		mobile_host	if mobile
#################################################

backend pc_host
	mode	http
	option	httplog
	balance	source
	server	web1 192.168.56.11:80 check inter 2000 rise 3 fall 2 weight 1


backend mobile_host
	mode	http
	option 	httplog
	balance source
	server web1	192.168.56.11:80 check inter 2000 rise 3 fall 2 weight 1


vim /etc/rsyslog.conf
$ModLoad imudp
$UDPServerRun 514

$ModLoad imtcp
$InputTCPServerRun 514

local6.* 	@@192.168.152.139:5160


重新启动rsyslog服务:
systemctl restart rsyslog

input{
 syslog {
   type => "rsyslog-5612"
   port => "5160"
 }
}

output {
  stdout {
     codec => rubydebug
  }
}

###########################
input{
 syslog {
   type => "rsyslog-5612"
   port => "5160"
 }
}
output {
 if [type] == "rsyslog-5612"{
   elasticsearch {
     hosts => ["192.168.152.139:9200"]
	 index => "rsyslog-5612-%{+YYYY.MM.dd}"
   }}
}
使用filebeat替代logstash收集日志
Filebeat是轻量级单用途的日志收集工具,用于在没有安装java的服务器上专门收集日志,可以将日志转发到logstash、elasticsearch或redis等场景中进行下一步处理。
官网下载地址:https://www.elastic.co/downloads/beats/filebeat
官方文档:https://www.elastic.co/guide/en/beats/filebeat/current/filebeat-configuration-details.html

确定日志格式为json格式:
先访问web服务器,以产生一定的日志,然后确认是json格式:
ab -n100 -c100 http://192.168.56.16:8080/web

安装:
yum -y install filebeat-5.4.0-x86_64.rpm


https://www.elastic/guide/en/beats/filebeat/current/filebeat-configuration-details.html


[root@linux-host2 src]# grep -v "#" /etc/filebeat/filebeat.yml | grep -v "^$"
filebeat.prospectors:
- input_type: log
  paths:
    - /var/log/*.log
    - /var/log/messages
  exclude_lines: ["^DBG","^$"]  #如果有空行,日志往数据写会报错
  document_type: system-log-5612 #日志类型
output.file:
  path: "/tmp"
  name: "filebeat.txt"
[root@linux-host2 src]# systemctl restart filebeat

测试使用echo形式:
echo "test" >> /var/log/messages

[root@linux-host2 src]# tail -f /tmp/filebeat
{"@timestamp":"2017-12-21T15:45:05.715Z","beat":{"hostname":"linux-host2.example.com","name":"linux-host2.example.com","version":"5.4.0"},"input_type":"log","message":"Dec 21 23:45:01 linux-host2 systemd: Starting Session 9 of user root.","offset":1680721,"source":"/var/log/messages","type":"system-log-5612"}

logstash收集日志并吸入redis:

输出到redis:
output.redis:
  hosts: ["192.168.56.12:6379"]
  db: "1" #使用第几个库
  timeout: "5" #超时时间
  password: "123456" #redis密码
  key: "system-log-5612" #为了后期日志处理,建议自定义

查看数据:
SELECT 3
KYES *
LLEN system-log-5612
RPOP system-log-5612


从redis取日志:
input {
  redis {
      data_type => "list"
      host => "172.20.8.13"
      db => "1"
      port => "6379"
      key => "system-log-0840"
      password => "123456"
  }
}
output {
  if [type] == "system-log-0840" {
    elasticsearch {
      hosts => ["172.20.8.12:9200"]
      index => "system-log-0840-%{+YYYY.MM.dd}"
    }
  }
}

logstash 一般是每秒几百行的数据,redis每秒钟上百万行数据
监控redis数据长度
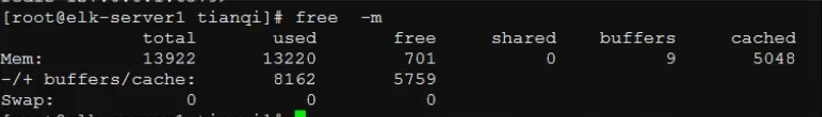
实际环境当中,可能会出现redis当中堆积了大量的数据而logstash由于种种原因未能及时提取日志,此时会导致redis服务器的内存被大量使用,甚至出现如下内存即将被使用完毕的情景:
查看redis中的日志队列长度发现有大量的日志堆积在redis当中:

安装redis模块:
yum install python-pip -y
pip install redis

报警脚本:
#!/usr/bin/env python
#coding:utf-8
#Author
import redis
def redis_conn():
    pool = redis.ConnectionPool(host="192.168.56.12",port=6379,db=1,password=123456)
	conn = redis.Redis(connection_pool=pool)
	data = conn.llen('tomcat-accesslog-5612')
	print(data)
redis_conn()
结合logstash进行输出测试
vim beats.conf
input{
    beats{
	    port => 5044
	}
}

output{
    stdout {
	    codec => rubydebug
	}
}

#将输出改为文件进行临时输出测试
output{
    file{
	    path => "/tmp/filebeat.txt"
	}
}


filebeat配置文件由redis更改为logstash:
output.logstash:
  hosts: ["192.168.56.11:5044"] #logstash 服务器地址,可以是多个
  enabled: true #是否开启输出至logstash,默认即为true
  worker: 2 #工作线程数
  compression_level: 3 #压缩级别
  loadbalance: true #多个输出的时候开启负载


配置logstash的配置文件收集beats的文件,再存入redis:
vim beats.conf
input{
    beats{
	    port => 5044
	}
}

output{
  if [type] == "filebeat-system-log-5612"{
  redis {
      data_type => "list"
	  host => "192.168.56.12"
	  db => "3"
	  port => "6379"
	  key => "filebeat-system-log-5612-%{+YYYY.MM.dd}"
	  password => "123456"
  }}
}


由redis中取数据,并写入elastsearch:
vim redis-es.yaml
input {
  redis {
      data_type => "list"
	  host => "192.168.56.12"
	  db = > "3"
	  port => "6379"
	  key => "filebeat-system1-log-5612"
	  password => "123456"
  }
}

output {
  if [type] == "filebeat-system1-log-5612" {
  elasticsearch {
    hosts => ["192.168.56.11:9200"]
	index => "filebeat-system1-log-5612-%{+YYYY.MM.dd}"
  }}
}
filebeat收集tomcat日志
filebeat配置中添加如下配置:
- input_type: log
  paths:
    - /usr/local/tomcat/logs/tomcat_access_log.*.log
  document_type: tomcat-accesslog-5612


grep -v "#" /etc/filebeat/filebeat.yml | grep -v "^$"
filebeat.prospectors:
- input_type: log
  paths:
    - /var/log/messages
    - /var/log/*.log
  exclude_lines: ["^DBG","^$"]
  document_type: filebeat-system-log-5612
- input_type: log
  paths:
    - /usr/local/tomcat/logs/tomcat_access_log.*.log
  document_type: tomcat-accesslog-5612
output.logstash:
  hosts: ["192.168.56.11:5044"]
  enabled: true
  worker: 2
  compression_level: 3

logstash收集redis中的日志,传给redis:
vim beats.conf
input{
    beats{
        port => 5044
    }
}

output{
  if [type] == "filebeat-system-log-5612"{
  redis {
      data_type => "list"
      host => "192.168.56.12"
      db => "3"
      port => "6379"
      key => "filebeat-system-log-5612-%{+YYYY.MM.dd}"
      password => "123456"
  }}
  if [type] == "tomcat-accesslog-5612" {
      redis {
      data_type => "list"
      host => "192.168.56.12"
      db => "4"
      port => "6379"
      key => "tomcat-accesslog-5612"
      password => "123456"
  }}
}

LPOP验证一下redis:


由redis中取数据,并写入elastsearch:
vim redis-es.yaml
input {
  redis {
      data_type => "list"
      host => "192.168.56.12"
      db => "3"
      port => "6379"
      key => "filebeat-system1-log-5612"
      password => "123456"
  }
  redis {
      data_type => "list"
      host => "192.168.56.12"
      db => "4"
      port => "6379"
      key => "tomcat-accesslog-5612"
      password => "123456"
  }
}

output {
  if [type] == "filebeat-system1-log-5612" {
  elasticsearch {
    hosts => ["192.168.56.11:9200"]
    index => "filebeat-system1-log-5612-%{+YYYY.MM.dd}"
  }}
  if [type] == "tomcat-accesslog-5612" {
  elasticsearch {
    hosts => ["192.168.56.12:9200"]
    index => "tomcat-accesslog-5612-%{+YYYY.MM.dd}"
  }}
}


添加到kibana:
添加代理
添加haproxy代理:

##################ACL Setting#################
	acl pc		hdr_dom(host) -i www.elk.com
	acl mobile	hdr_dom(host) -i m.elk.com
	acl kibana	hdr_dom(host) -i www.kibana5612.com
##################USE ACL######################
	use_backend	pc_host			if pc
	use_backend mobile_host		if mobile
	use_backend kibana_host		if kibana
###############################################

backend kibana_host
	mode http
	option httplog
	balance source
	server web1 127.0.0.1:5601 check inter 2000 rise 3 fall 2 weight 1

kibana配置:
server.port: 5601
server.host: "127.0.0.1"
elasticsearch.url: "http://192.168.56.12:9200"

systemctl start kibana
systemctl enable kibana


Nginx代理并授权:
vim nginx.conf
include /usr/local/nginx/conf/conf.d/*.conf;

vim /usr/local/nginx/conf/conf.d/kibana5612.conf
upstream kibana_server {
	server 127.0.0.1:5601 weight=1 max_fails=3 fail_timeout=60;
}

server {
	listen 80;
	server_name www.kibana5611.com;
	location /{
	proxy_pass http://kibana_server;
	proxy_http_version 1.1;
	proxy_set_header Upgrade $http_upgrade;
	proxy_set_header Connection 'upgrade';
	proxy_set_header Host $host;
	proxy_cache_bypass $http_upgrade;
	}
}

yum install httpd-tools -y
#第一次需要加-c
htpasswd -bc /usr/local/nginx/conf/htpasswd.users luchuangao 123456
#第二次需要把-c去掉,否则会覆盖原有得。
htpasswd -b /usr/local/nginx/conf/htpasswd.users luchuangao 123456
#查看tail /usr/local/nginx/conf/htpasswd.users
...
#授权
chown nginx.nginx /usr/local/nginx/conf/htpasswd.users
#重启服务
/usr/local/nginx/sbin/nginx -s reload

添加进nginx配置文件:
vim /usr/local/nginx/conf/conf.d/kibana5612.conf
upstream kibana_server {
	server 127.0.0.1:5601 weight=1 max_fails=3 fail_timeout=60;
}

server {
	listen 80;
	server_name www.kibana5611.com;
	auth_basic "Restricted Access";
	auth_basic_user_file /usr/local/nginx/conf/htpasswd.users;
	location /{
	proxy_pass http://kibana_server;
	proxy_http_version 1.1;
	proxy_set_header Upgrade $http_upgrade;
	proxy_set_header Connection 'upgrade';
	proxy_set_header Host $host;
	proxy_cache_bypass $http_upgrade;
	}
}
elk定时删除索引
http://www.iyunw.cn/archives/elk-mei-ri-qing-chu-30-tian-suo-yin-jiao-ben/