附录一个:Keras学习随笔 http://blog.csdn.net/niuwei22007/article/details/49045909
参考 《Python Machine Learning》这本书的第13章
Theano是Bengio大神课题组弄得。
一、Theano初步
Theano编程三个步骤: 初始化、编译和执行,就是定义符号(变量对象)、编译代码和执行代码
举个例子:计算 z=x1*w1+wo 代码如下:
 1 # -*- coding: utf-8 -*-
 2 __author__ = 'Administrator'
 3
 4 import theano
 5 import  theano.tensor as T
 6 import  random
 7 import  numpy as np
 8 from itertools import izip
 9 import matplotlib.pyplot as plt
10
11 #初始化
12 x1 = T.scalar()
13 w1 = T.scalar()
14 w0 = T.scalar()
15 z = w1*x1+w0
16
17 #编译
18
19 net_input = theano.function(
20     inputs=[w1, x1, w0],
21     outputs=z
22 )
23
24 #执行
25
26 print 'net input %.2f'% (net_input(2.0, 1.0 ,0.5))
在写Theano代码时,要注意变量的类型 dtype ,要分清楚我们要使用 64或者32为的int or floats
二、 配置Theano
一般来说 采用CPU时,我们设置float64 ,采用GPU时,需要设置float32
print (theano.config.floatX)
print (theano.config.device)
在window中设置CPU or GPU模式,是在运行cmd后出现的路径下,新建一个.theanorc.txt的文件。文件内容如下图所示

三、使用array结构
一个简单的求和例子
 1 #初始化
 2 x = T.fmatrix(name ='x')
 3 x_sum = T.sum(x, axis=1) # 0  是按列 1 是按行
 4
 5 #编译
 6 calc_sum = theano.function(
 7     inputs=[x],
 8     outputs=x_sum
 9 )
10
11 #执行
12 ary = np.array([[1,2,4],[1,2,3]],dtype=theano.config.floatX)
13 print calc_sum(ary)
shared variable 和 权值更新
 1 #初始化
 2 x =  T.fmatrix('x')
 3 w = theano.shared(np.asarray([[0.0,0.0,0.0]],dtype=theano.config.floatX))
 4
 5 z = T.dot(x,w.T) # 这个就是两个矩阵相乘 w是1*3  x是1*3
 6
 7 update = [[w, w+1.0]]
 8
 9 # 编译
10 net_input = theano.function(
11     inputs=[x],
12     updates=update,
13     outputs=z
14 )
15
16 # 执行
17
18 data = np.array([[1,2,3]],dtype=theano.config.floatX)
19 for i in range(5):
20     print w.get_value()
21     print '%d   %.2f' % (i,net_input(data))
可以提取指定数据,代码如下
 1 #初始化
 2 data = np.array([[1,2,3]],dtype=theano.config.floatX)
 3 x =  T.fmatrix('x')
 4 w = theano.shared(np.asarray([[0.0,0.0,0.0]],dtype=theano.config.floatX))
 5
 6 z = T.dot(x,w.T) # 这个就是两个矩阵相乘 w是1*3  x是1*3
 7
 8 update = [[w, w+1.0]]
 9
10 # 编译
11 net_input = theano.function(
12     inputs=[],
13     updates=update,
14     givens={x : data},
15     outputs=z
16 )
17
18 # 执行
19
20 for i in range(5):
21     print w.get_value()
22     print '%d   %.2f' % (i,net_input())
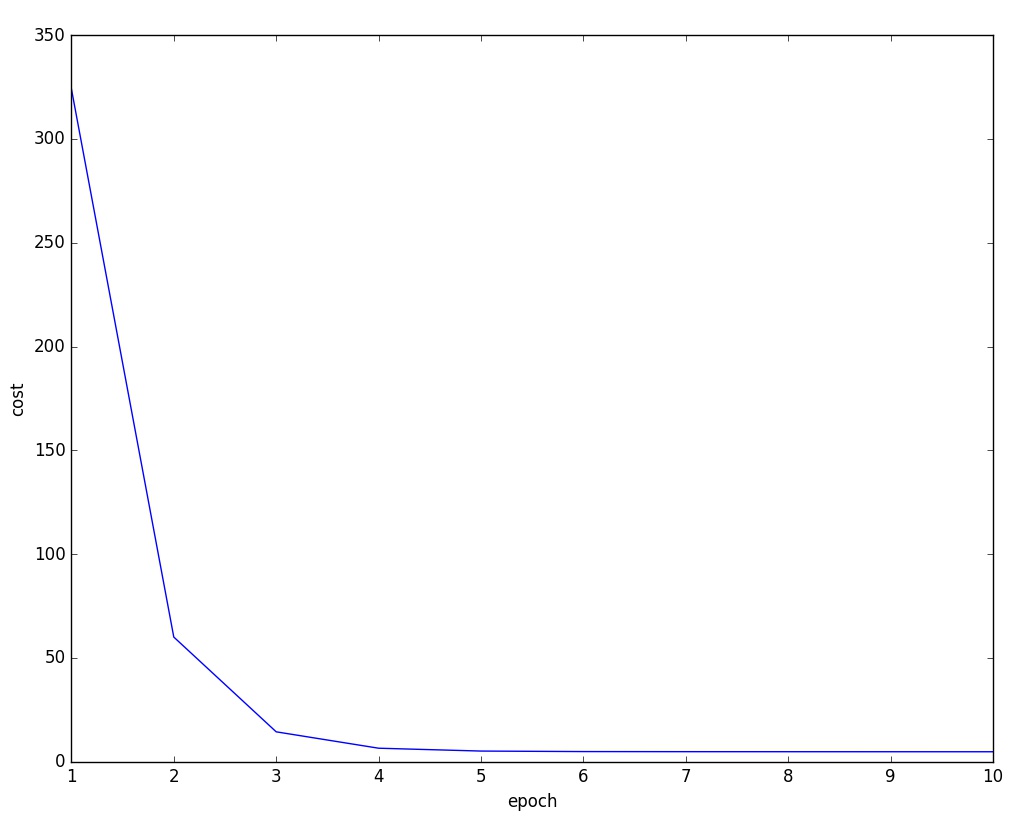
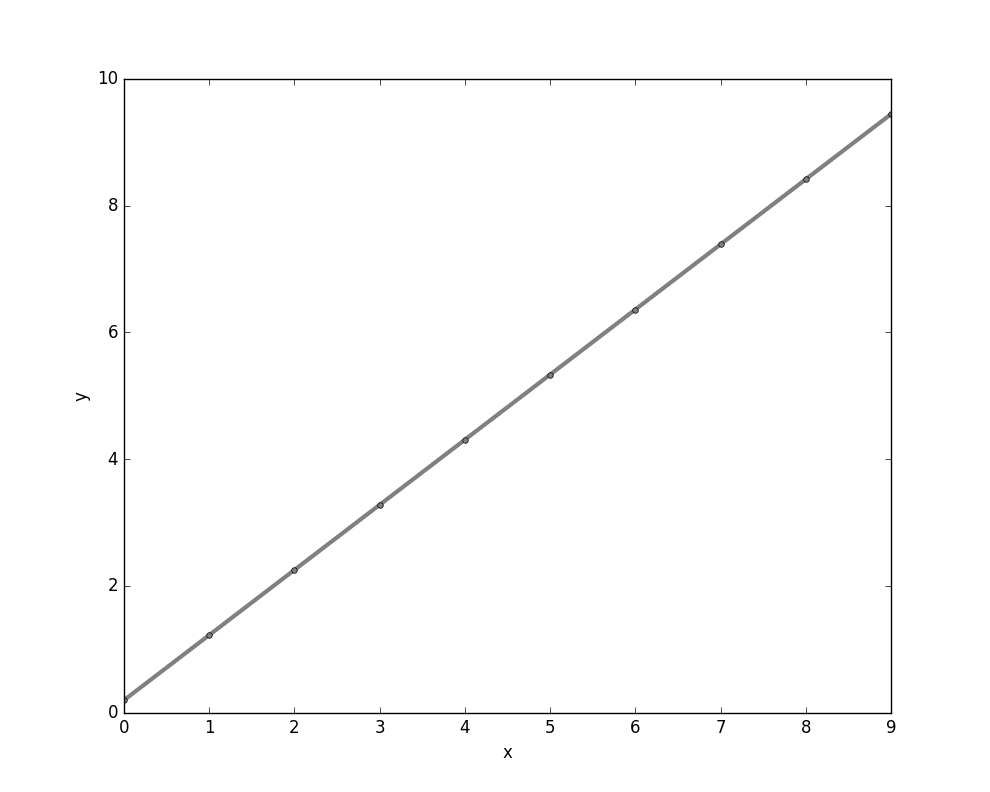
四、 一个线性回归的例子
 1 X_train = np.asarray(
 2     [ [0,0] , [1, 0],
 3       [2,0] , [3, 0],
 4       [4,0] , [5, 0],
 5       [6,0] , [7, 0],
 6       [8,0] , [9, 0]],
 7     dtype= theano.config.floatX
 8     )
 9
10 y_train = np.asarray(
11     [ 1.0,1.3,3.1,2.0,
12       5.0,6.3,6.6,7.4,
13       8.0,9.0],
14     dtype= theano.config.floatX
15     )
16
17 y_train_new = np.asarray(
18     [ [1.0],[1.3],[3.1],[2.0],
19       [5.0],[6.3],[6.6],[7.4],
20       [8.0],[9.0]],
21     dtype= theano.config.floatX
22     )
23 print X_train.shape[1] # shape 0 获取行 shape 1 获取列
24
25 def train_linreg(X_train, y_train ,eta, epochs):
26     costs = []
27     #初始化array0
28     eta0 = T.fscalar('eta0')
29     y = T.fvector(name='y')
30     X = T.fmatrix(name='X')
31     w = theano.shared(np.zeros(
32         shape=(X_train.shape[1] +1 ),dtype= theano.config.floatX), name = 'w')
33
34     #计算损失函数
35     net_input = T.dot(X, w[1:]) + w[0] # w[1:] 从第二个到最后一个数据
36     errors = y - net_input
37     cost = T.sum(T.pow(errors,2))
38
39     #梯度更新
40     gradient = T.grad(cost,wrt=w)
41     update = [(w, w- eta0* gradient)]
42
43     #定义模型
44     train = theano .function(inputs=[eta0],
45                              outputs=cost,
46                              updates=update,
47                              givens={X:X_train,
48                                      y: y_train})
49
50
51     for i in range(epochs):
52         costs.append(train(eta))
53         print w.get_value()
54     return  costs, w
55
56 def predict_linreg(X,w):
57     Xt = T.matrix(name='X')
58     net_input = T.dot(Xt, w[1:])+w[0]
59     predict = theano.function(inputs=[Xt],
60                               givens={w:w},
61                               outputs= net_input)
62     return  predict(X)
63
64
65 costs,w= train_linreg(X_train,y_train,eta=0.001,epochs=10)
66 plt.plot(range(1,len(costs)+1),costs)
67 plt.tight_layout()
68 plt.xlabel("epoch")
69 plt.ylabel('cost')
70 plt.show()
71     #
72 #plt.scatter(X_train, y_train ,marker='s',s=50)
73 plt.plot(range(X_train.shape[0]),predict_linreg(X_train,w),color='gray',marker='o',markersize=4,linewidth=3)
74 plt.xlabel("x")
75 plt.ylabel('y')
76 plt.show()
结果图: