下载rpm
wget https://s3-us-west-2.amazonaws.com/grafana-releases/release/grafana-4.4.3-1.x86_64.rpm
本地安装
yum localinstall grafana-4.4.3-1.x86_64.rpm
编译配置文件
vim /etc/grafana/grafana.ini
#默认数据、插件、日志存放

[paths]
# Path to where grafana can store temp files, sessions, and the sqlite3 db (if that is used)
#
data = /var/lib/grafana
#
# Directory where grafana can store logs
#
logs = /var/log/grafana
#
# Directory where grafana will automatically scan and look for plugins
#
plugins = /var/lib/grafana/plugins

#选择数据库
[database]
# You can configure the database connection by specifying type, host, name, user and password
# as seperate properties or as on string using the url propertie.

# Either "mysql", "postgres" or "sqlite3", it's your choice
type = mysql
host = 127.0.0.1:3306
name = grafana
user = root
# If the password contains # or ; you have to wrap it with trippel quotes. Ex """#password;"""
password = 123456

#设置登陆
[security]
# default admin user, created on startup
admin_user = admin

# default admin password, can be changed before first start of grafana,  or in profile settings
admin_password = admin

#设置存放日志的方式
[log.file]
;level =

# log line format, valid options are text, console and json
;format = text

# This enables automated log rotate(switch of following options), default is true
log_rotate = true

# Max line number of single file, default is 1000000
max_lines = 1000000

# Max size shift of single file, default is 28 means 1 << 28, 256MB
max_size_shift = 28

# Segment log daily, default is true
daily_rotate = true

# Expired days of log file(delete after max days), default is 7
max_days = 7
如果有修改请修改启动文件里面的配置地址
PATH=/bin:/usr/bin:/sbin:/usr/sbin
NAME=grafana-server
DESC="Grafana Server"

GRAFANA_USER=grafana
GRAFANA_GROUP=grafana
GRAFANA_HOME=/usr/share/grafana
CONF_DIR=/etc/grafana
WORK_DIR=$GRAFANA_HOME
DATA_DIR=/var/lib/grafana
PLUGINS_DIR=/var/lib/grafana/plugins
LOG_DIR=/var/log/grafana
CONF_FILE=$CONF_DIR/grafana.ini
MAX_OPEN_FILES=10000
PID_FILE=/var/run/$NAME.pid
DAEMON=/usr/sbin/$NAME
启动granfana
service grafana-server start
访问granfana地址(ip+port)

增加datasources


增加dashboard
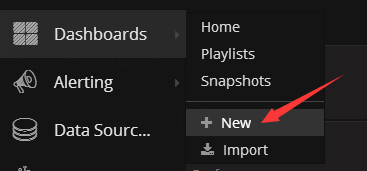
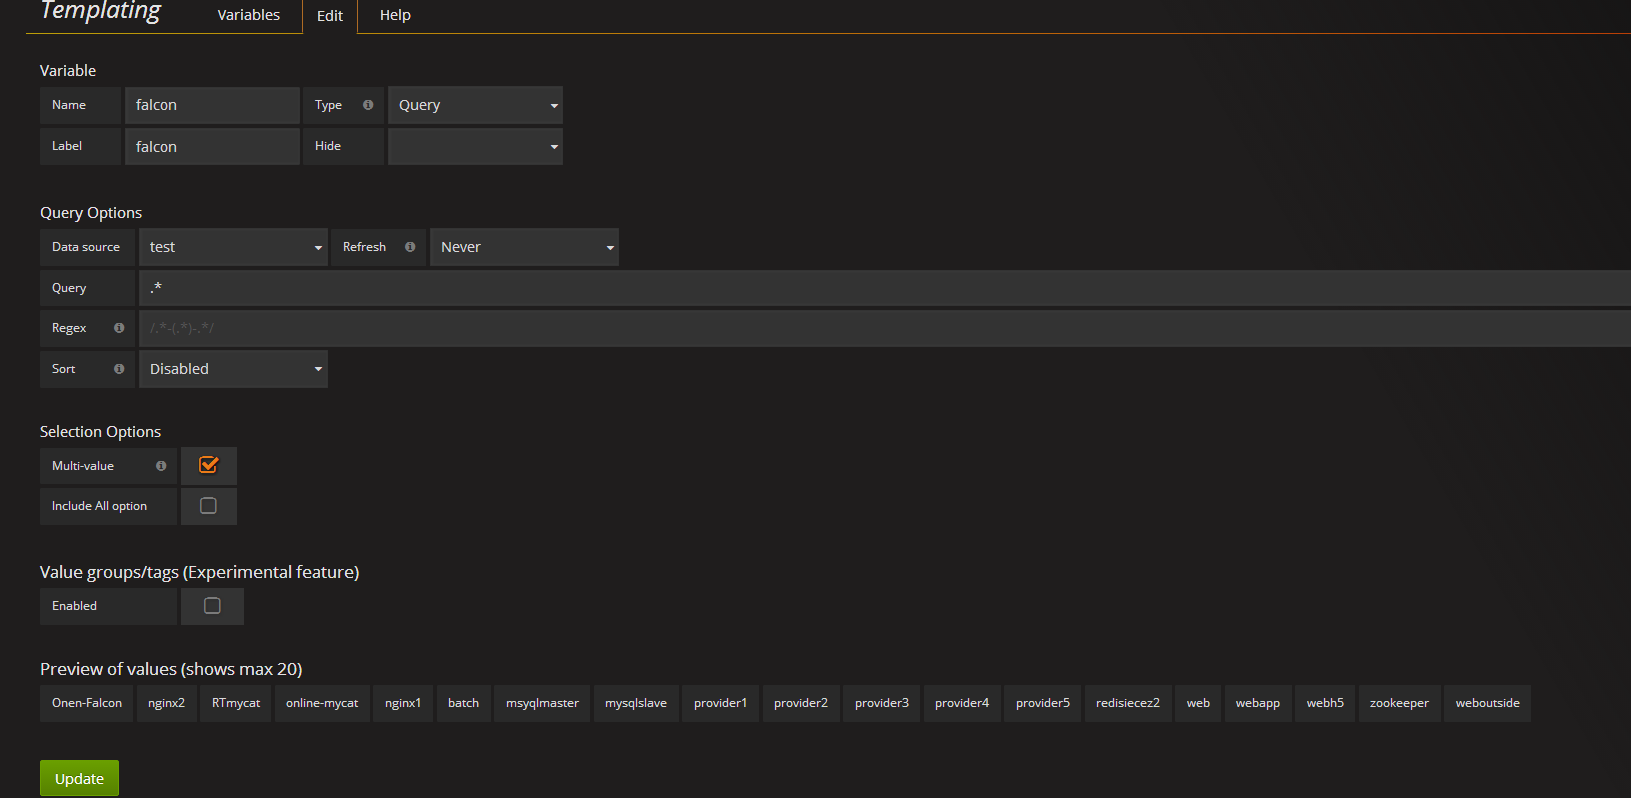
增加templating
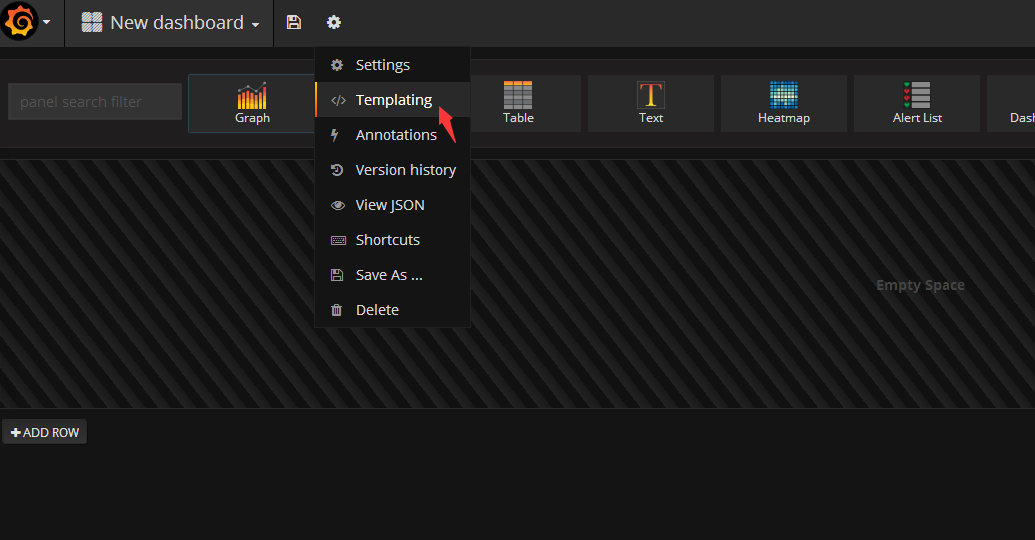
直接保存就行,默认我就是空
增加


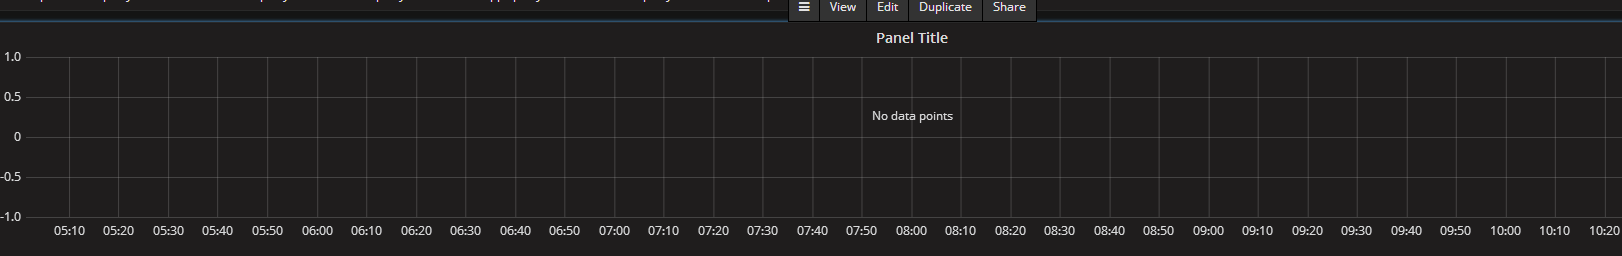
点击 ADD ROW选择graph

在标题上点左键-点edit
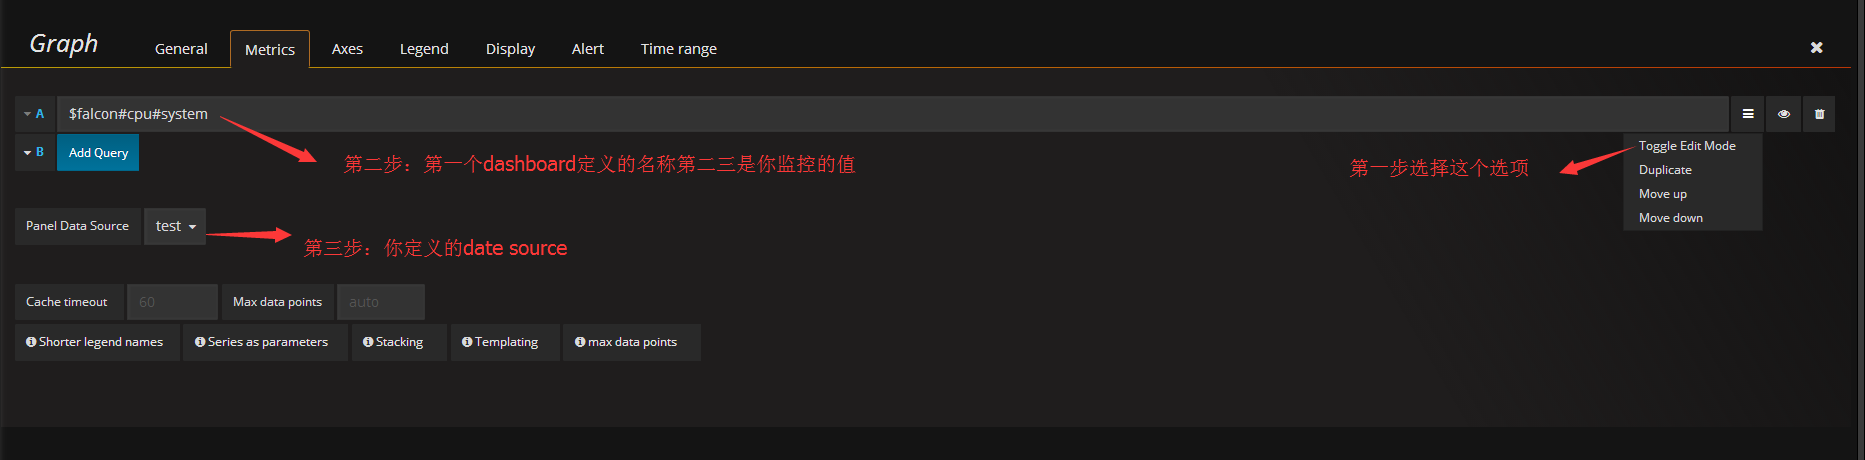
增加展示名称

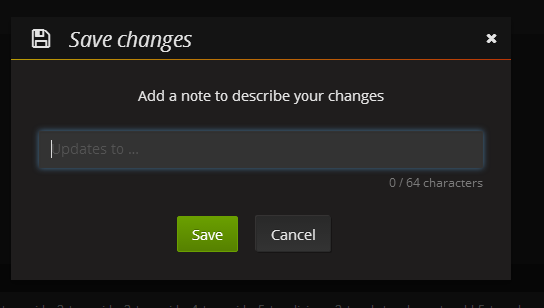
保存 我默认为空
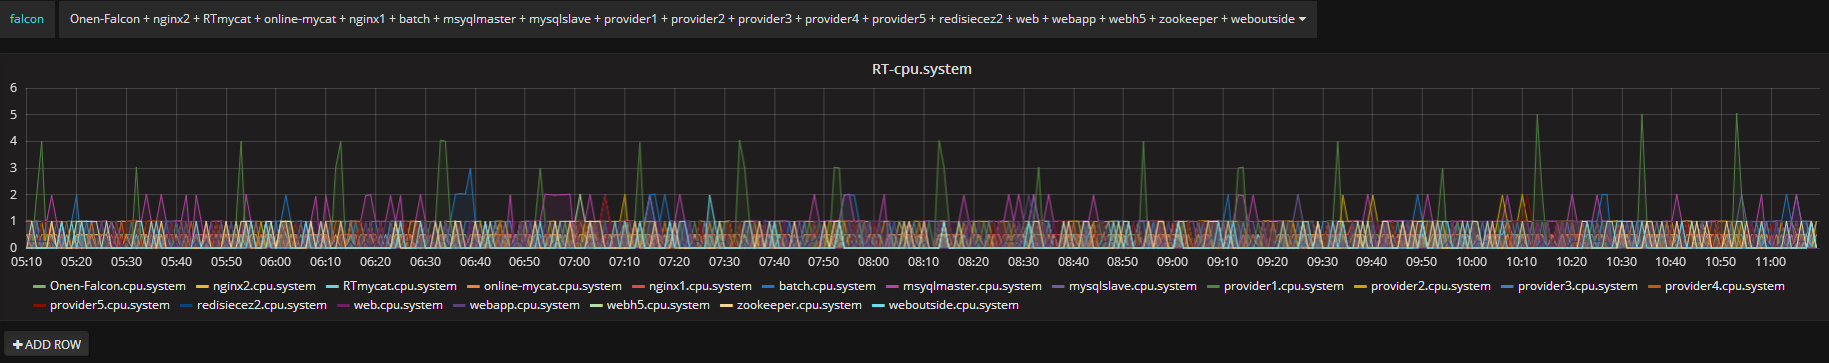
点击这个下拉箭头可以选择你安装过agent的机器进行监控

保存 我默认为空