数据获取
import os
import tarfile
import urllib.request
DOWNLOAD_ROOT = 'https://raw.githubusercontent.com/ageron/handson-ml2/master/'
HOUSING_PATH = os.path.join('datasets', 'housing')
HOUSING_URL = DOWNLOAD_ROOT + 'datasets/housing/housing.tgz'
def fetch_housing_data(housing_url=HOUSING_URL, housing_path=HOUSING_PATH):
if not os.path.isdir(housing_path):
os.makedirs(housing_path)
tgz_path = os.path.join(housing_path, 'housing.tgz')
urllib.request.urlretrieve(housing_url, tgz_path)
housing_tgz = tarfile.open(tgz_path)
housing_tgz.extractall(path=housing_path)
housing_tgz.close()
fetch_housing_data()
import pandas as pd
def load_housing_data(housing_path=HOUSING_PATH):
csv_path = os.path.join(housing_path, 'housing.csv')
return pd.read_csv(csv_path)
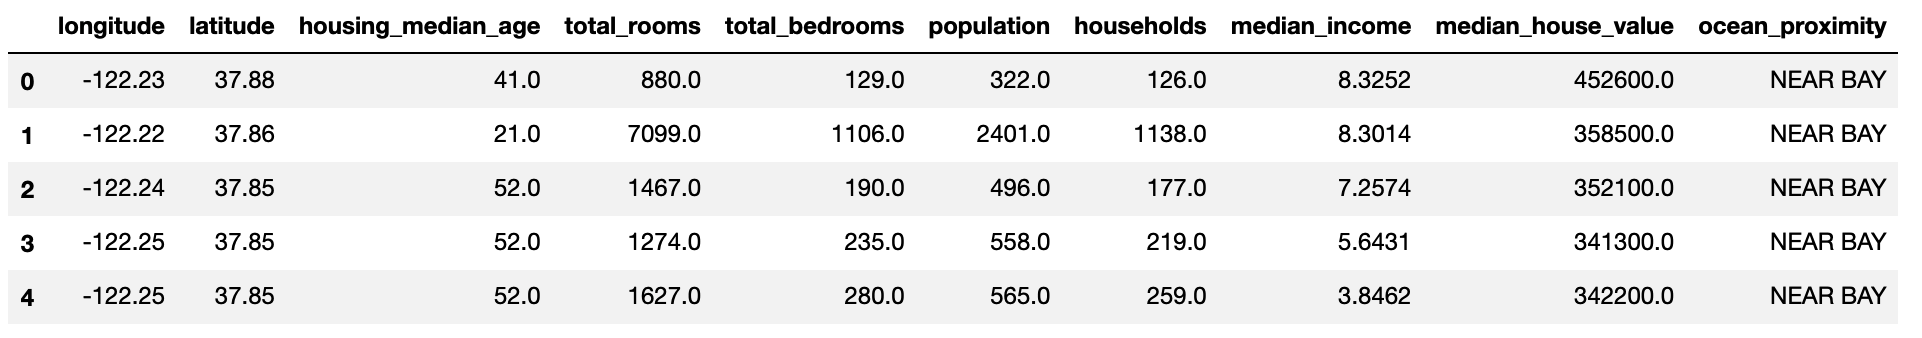
housing = load_housing_data()
housing.head()
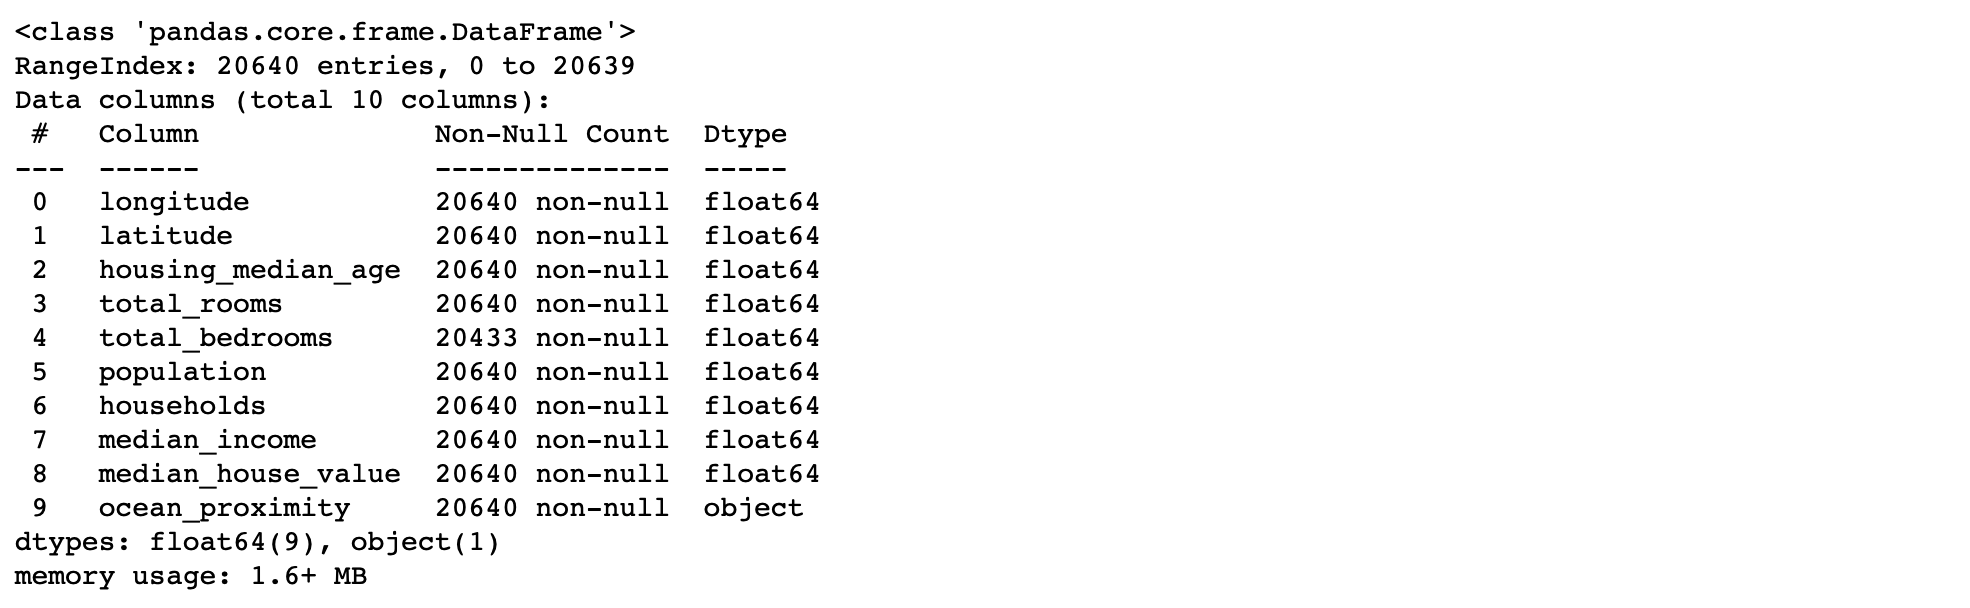
数据洞察
housing.info()
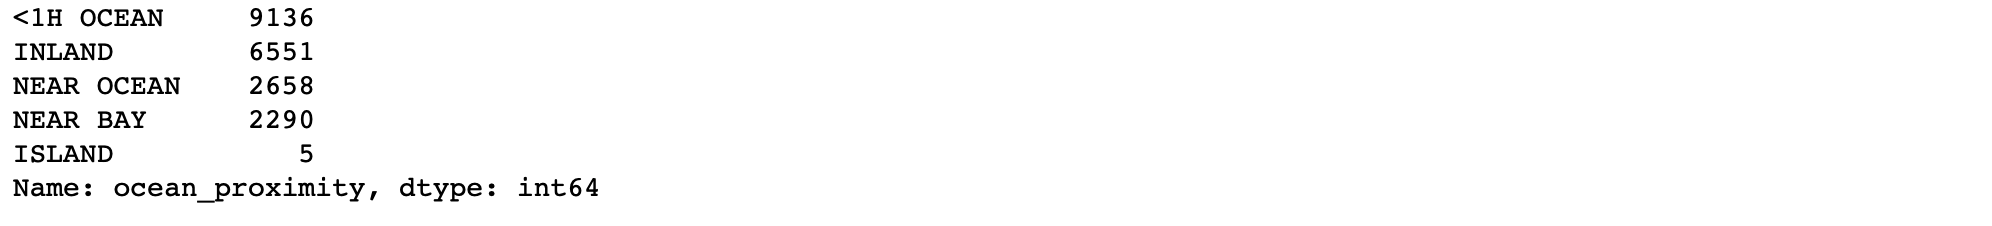
housing['ocean_proximity'].value_counts()
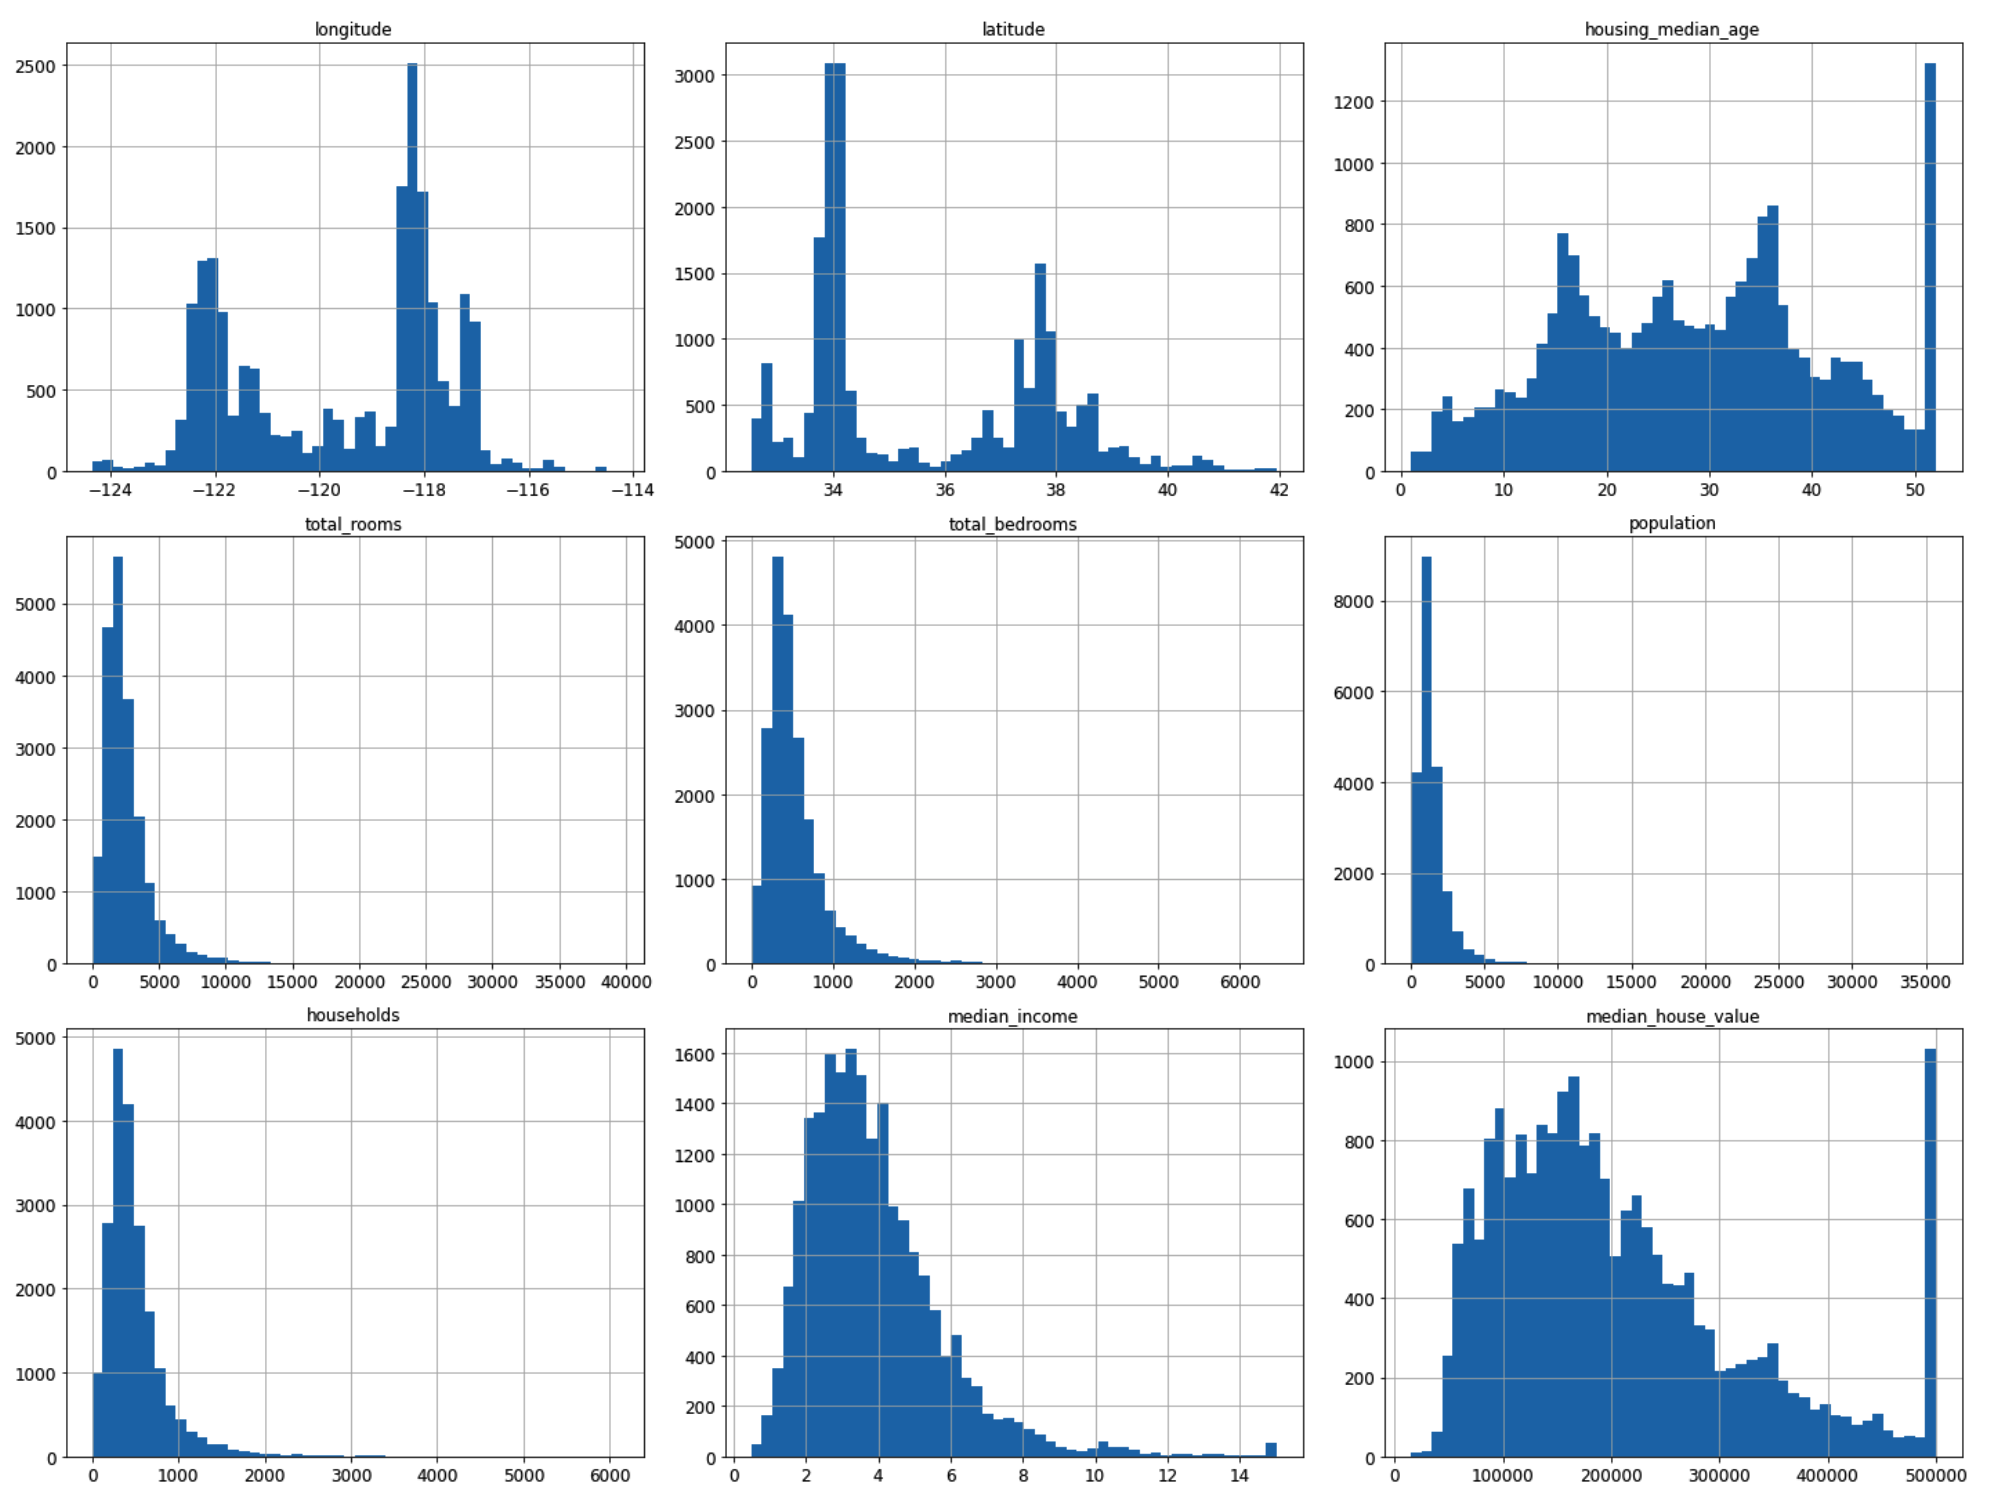
%matplotlib inline
import matplotlib.pyplot as plt
housing.hist(bins=50, figsize=(20, 15))
plt.show()
from sklearn.model_selection import StratifiedShuffleSplit

split = StratifiedShuffleSplit(n_splits=1, test_size=0.2, random_state=42)  # 分一组train/test
for train_index, test_index in split.split(housing, housing['income_cat']):
    strat_train_set = housing.loc[train_index]
    strat_test_set = housing.loc[test_index]
# housing为训练集副本
housing = strat_train_set.copy()
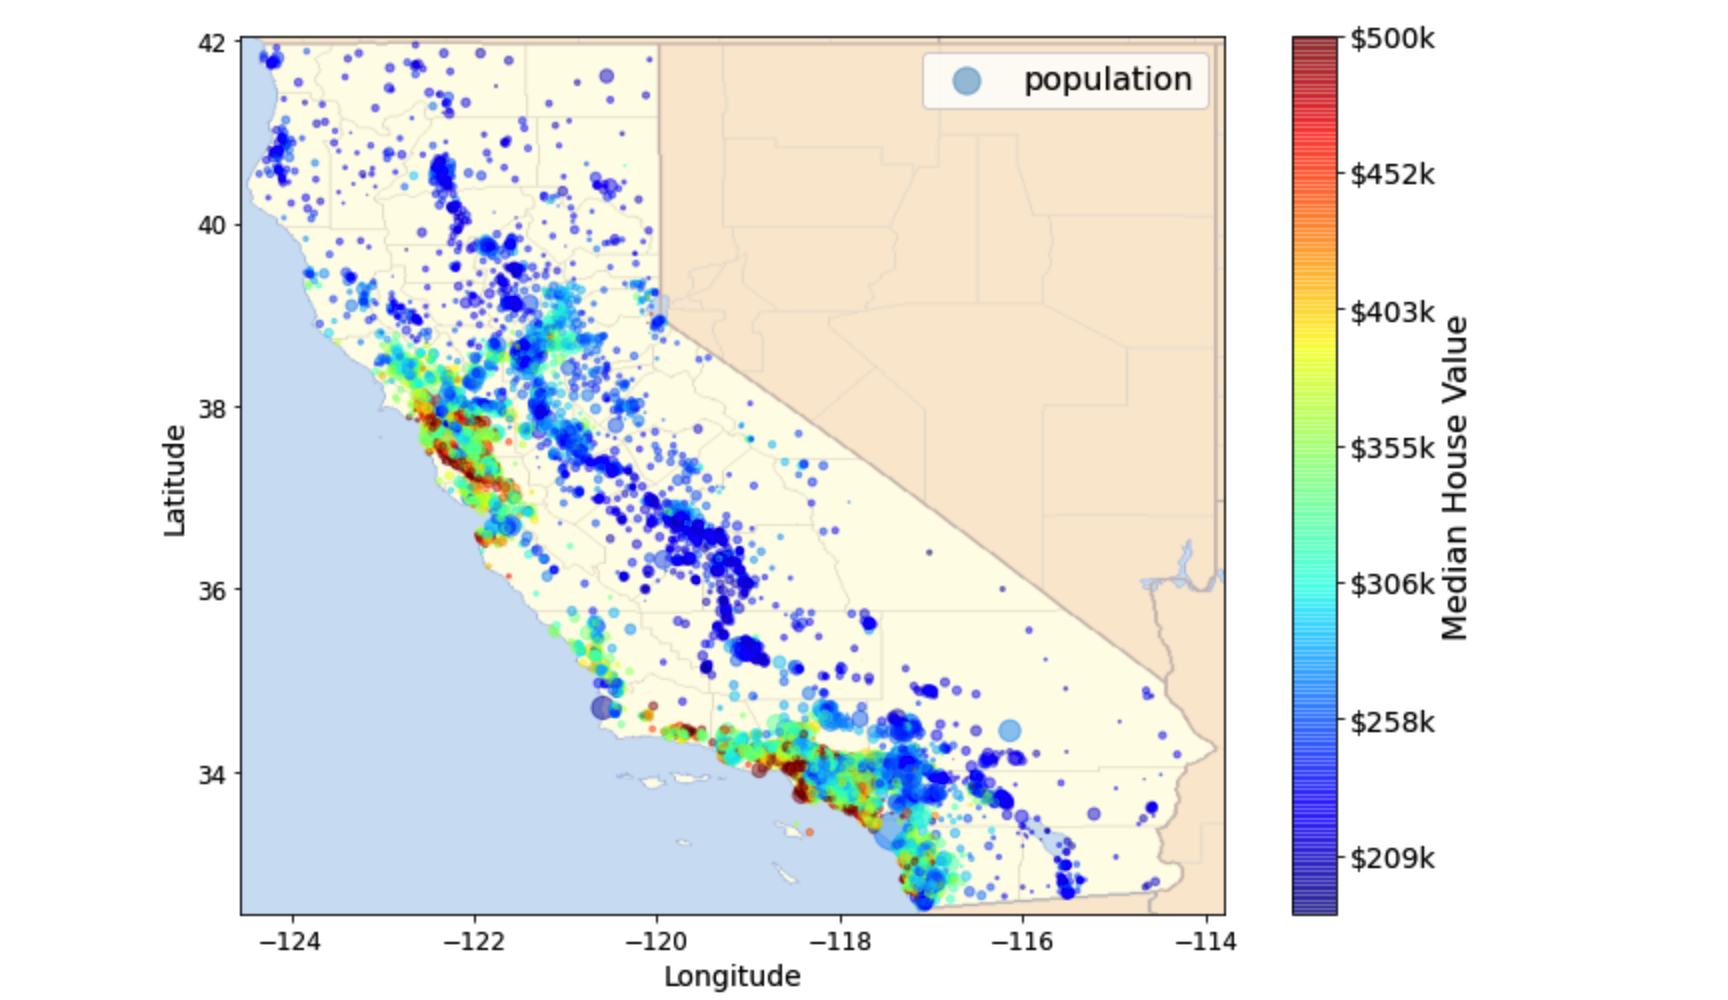
# 下载加利福尼亚州地图
images_path = os.path.join(PROJECT_ROOT_DIR, 'images', 'end_to_end_project')
DOWNLOAD_ROOT = 'https://raw.githubusercontent.com/ageron/handson-ml2/master/'
filename = 'california.png'
print('Downloading', filename)
url = DOWNLOAD_ROOT + 'images/end_to_end_project/' + filename
urllib.request.urlretrieve(url, os.path.join(images_path, filename))
import matplotlib.image as mpimg
california_img = mpimg.imread(os.path.join(images_path, filename))
ax = housing.plot(kind='scatter', x='longitude', y='latitude', figsize=(10, 7), s=housing['population']/100,
label='population', c='median_house_value', cmap=plt.get_cmap('jet'), colorbar=False, alpha=0.4)
plt.imshow(california_img, extent=[-124.55, -113.80, 32.45, 42.05], alpha=0.5, cmap=plt.get_cmap('jet'))
plt.ylabel('Latitude', fontsize=14)
plt.xlabel('Longitude', fontsize=14)
prices = housing['median_house_value']
tick_values = np.linspace(prices.min(), prices.max(), 11)
cbar = plt.colorbar(ticks=tick_values/prices.max())
cbar.ax.set_yticklabels(['$%dk'%(round(v/1000)) for v in tick_values], fontsize=14)
cbar.set_label('Median House Value', fontsize=16)
plt.legend(fontsize=16)
plt.show()
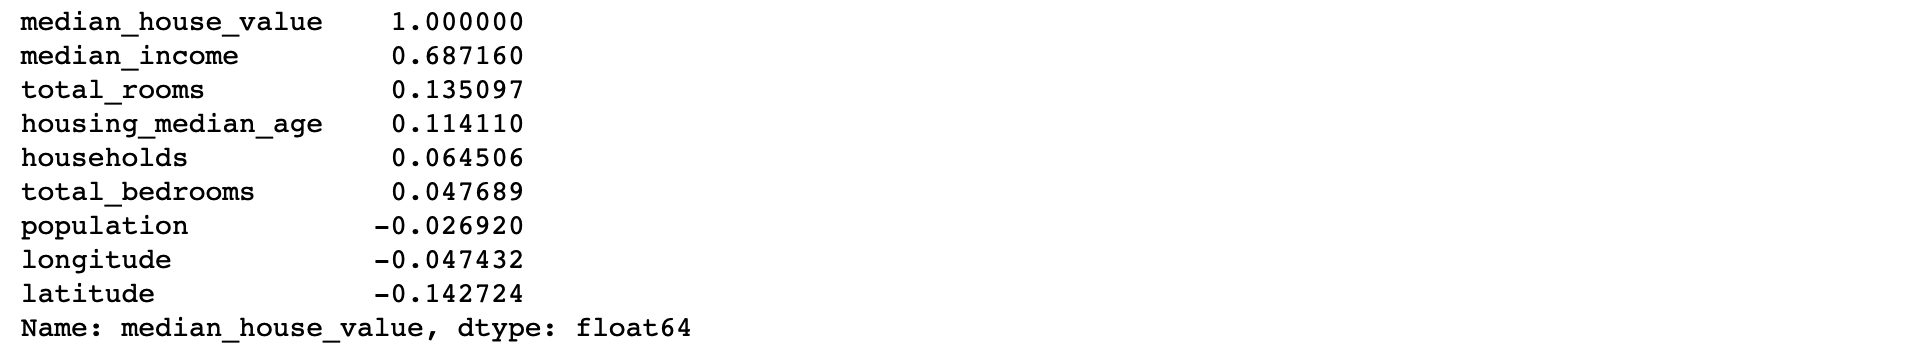
corr_matrix = housing.corr()
corr_matrix['median_house_value'].sort_values(ascending=False)
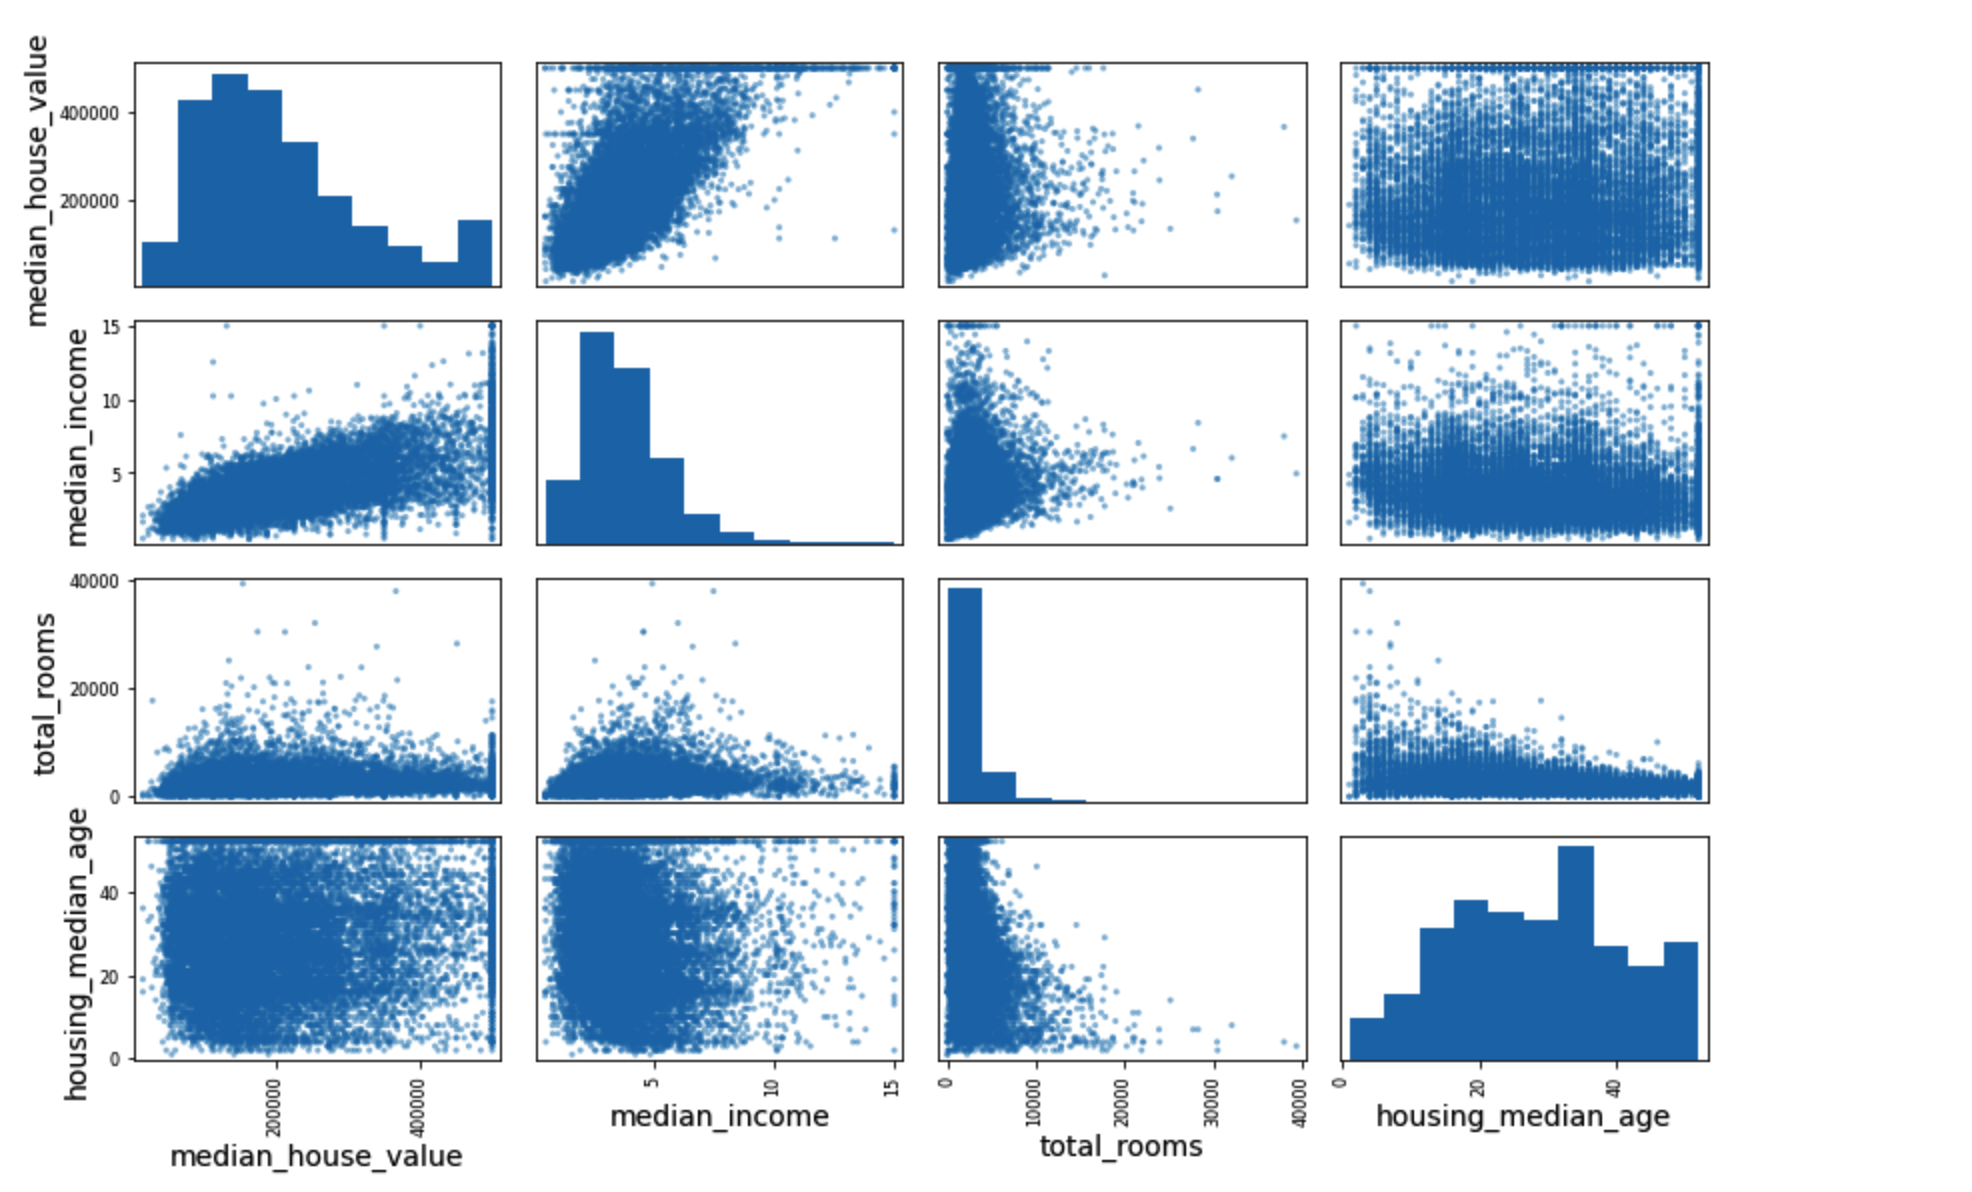
from pandas.plotting import scatter_matrix

attributes = ['median_house_value', 'median_income', 'total_rooms', 'housing_median_age']
scatter_matrix(housing[attributes], figsize=(12, 8))
save_fig('scatter_matrix_plot')
数据准备及预处理
housing = strat_train_set.drop('median_house_value', axis=1)  # drop labels for training set
housing_labels = strat_train_set['median_house_value'].copy()
housing_num = housing.drop('ocean_proximity', axis=1)

from sklearn.base import BaseEstimator, TransformerMixin

# 列索引
rooms_ix, bedrooms_ix, population_ix, households_ix = 3, 4, 5, 6

class CombinedAttributesAdder(BaseEstimator, TransformerMixin):
    def __init__(self, add_bedrooms_per_room=True):  # no *args or **kwargs
        self.add_bedrooms_per_room = add_bedrooms_per_room
    def fit(self, X, y=None):
        return self  # nothing else to do
    def transform(self, X):
        rooms_per_household = X[:, rooms_ix] / X[:, households_ix]
        population_per_household = X[:, population_ix] / X[:, households_ix]
        if self.add_bedrooms_per_room:
            bedrooms_per_room = X[:, bedrooms_ix] / X[:, rooms_ix]
            return np.c_[X, rooms_per_household, population_per_household, bedrooms_per_room]
        else:
            return np.c_[X, rooms_per_household, population_per_household]

# 构建一个用于预处理数值属性的管道
from sklearn.pipeline import Pipeline
from sklearn.preprocessing import StandardScaler

num_pipeline = Pipeline([
    ('imputer', SimpleImputer(strategy='median')),
    ('attribs_addr', CombinedAttributesAdder()),
    ('std_scaler', StandardScaler()),
])

'''
ColumnTransformer()在Python的机器学习库scikit-learn中,可以选择地进行数据转换。例如,它允许将特定的转换或转换序列仅应用于数字列,而将单独的转换序列仅应用于类别列。要使用ColumnTransformer,必须指定一个转换器列表。每个转换器是一个三元素元组,用于定义转换器的名称,要应用的转换以及要应用于其的列索引,例如:(名称,对象,列)
'''

from sklearn.compose import ColumnTransformer

num_attribs = list(housing_num)
cat_attribs = ['ocean_proximity']
full_pipeline = ColumnTransformer([
    ('num', num_pipeline, num_attribs),
    ('cat', OneHotEncoder(), cat_attribs),
])
housing_prepared = full_pipeline.fit_transform(housing)
模型选择及训练
def dispaly_scores(scores):
    print('Scores:', scores)
    print('Mean:', scores.mean())
    print('Standard deviation:', scores.std())
# 线性回归
from sklearn.linear_model import LinearRegression
from sklearn.metrics import mean_squared_error
from sklearn.metrics import mean_absolute_error

lin_reg = LinearRegression()
# lin_reg.fit(housing_prepared, housing_labels)
# housing_predictions = lin_reg.predict(housing_prepared)
# lin_mse = mean_squared_error(housing_labels, housing_predictions)
# lin_rmse = mean_squared_error(housing_labels, housing_predictions, squared=False)  # 68628.19819848923
# lin_mae = mean_absolute_error(housing_labels, housing_predictions)
lin_scores = cross_val_score(lin_reg, housing_prepared, housing_labels, scoring='neg_mean_squared_error', cv=10)
lin_rmse_scores = np.sqrt(-lin_scores)
dispaly_scores(lin_rmse_scores)

# 决策树回归
from sklearn.tree import DecisionTreeRegressor

tree_reg = DecisionTreeRegressor(random_state=42)
scores = cross_val_score(tree_reg, housing_prepared, housing_labels, scoring='neg_mean_squared_error', cv=10)
tree_rmse_scores = np.sqrt(-scores)

# 随机森林回归
from sklearn.ensemble import RandomForestRegressor

forest_reg = RandomForestRegressor(n_estimators=100, random_state=42)
forest_scores = cross_val_score(forest_reg, housing_prepared, housing_labels, scoring='neg_mean_squared_error', cv=10)
forest_rmse_scores = np.sqrt(-forest_scores)
dispaly_scores(forest_rmse_scores)

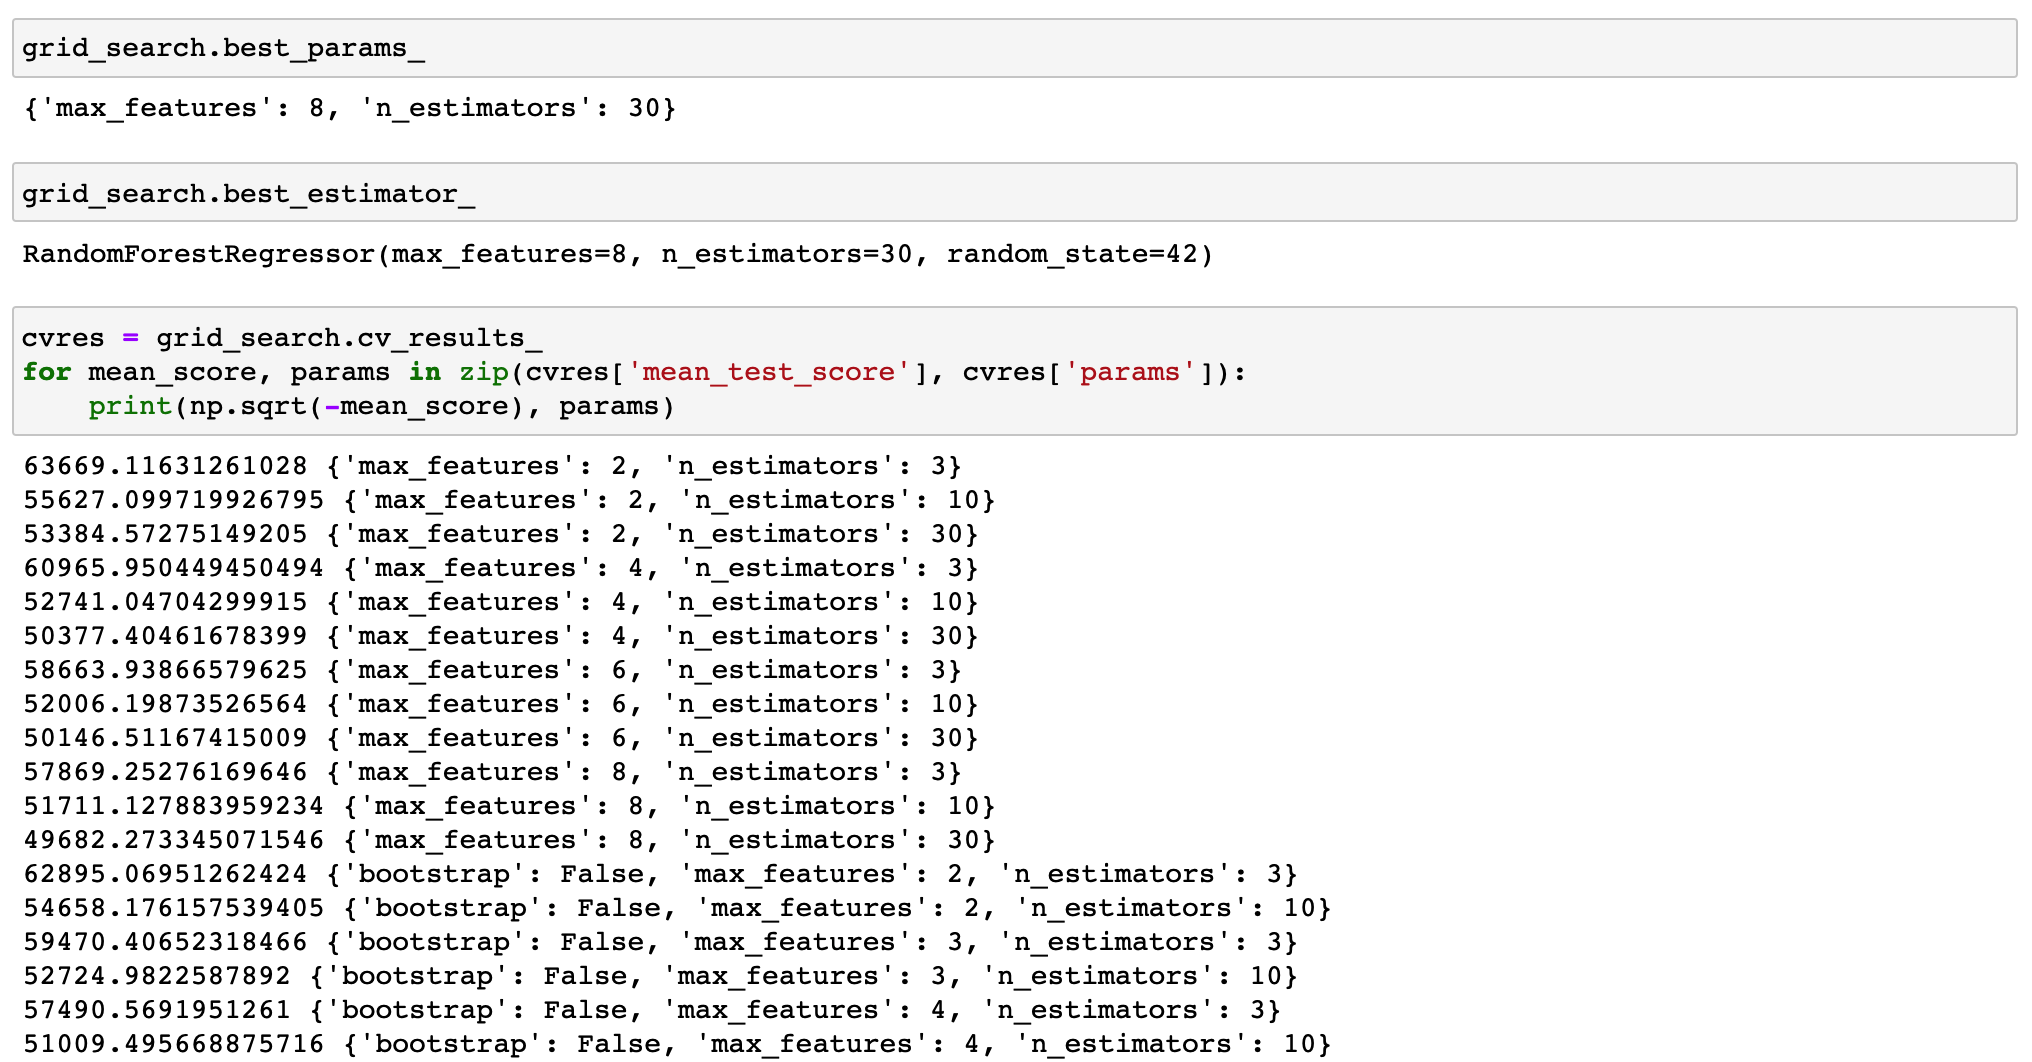
from sklearn.model_selection import GridSearchCV

# 如果bootstrap==True,将每次有放回地随机选取样本,自助法
param_grid = [
    # try 12 (3*4) combinations of hyperparameters
    {'n_estimators': [3, 10, 30], 'max_features': [2, 4, 6, 8]},
    # then try 6 (2*3) combinations with bootstrap set as Fasle
    {'bootstrap': [False], 'n_estimators': [3, 10], 'max_features': [2, 3, 4]},
]
forest_reg = RandomForestRegressor(random_state=42)
# 5折网格搜索
grid_search = GridSearchCV(forest_reg, param_grid, cv=5, scoring='neg_mean_squared_error', return_train_score=True)
grid_search.fit(housing_prepared, housing_labels)
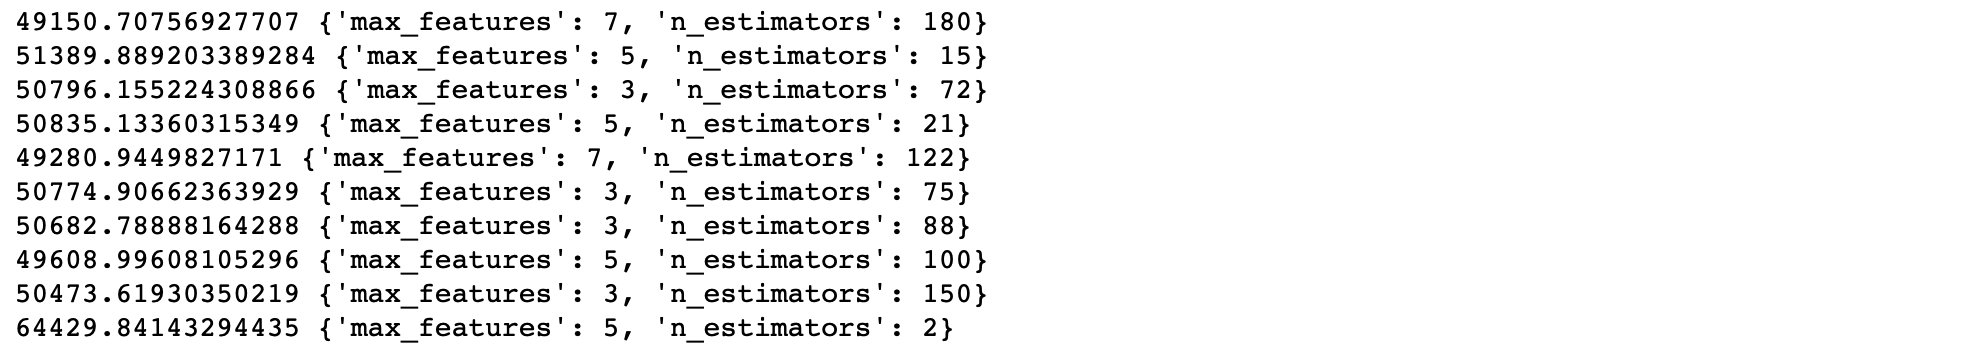
from sklearn.model_selection import RandomizedSearchCV
from scipy.stats import randint

param_distribs = {
    'n_estimators': randint(low=1, high=200),
    'max_features': randint(low=1, high=8),
}
forest_reg = RandomForestRegressor(random_state=42)
rnd_search = RandomizedSearchCV(forest_reg, param_distributions=param_distribs, n_iter=10, cv=5,
                               scoring='neg_mean_squared_error', random_state=42)
rnd_search.fit(housing_prepared, housing_labels)

cvres = rnd_search.cv_results_
for mean_score, params in zip(cvres['mean_test_score'], cvres['params']):
    print(np.sqrt(-mean_score), params)
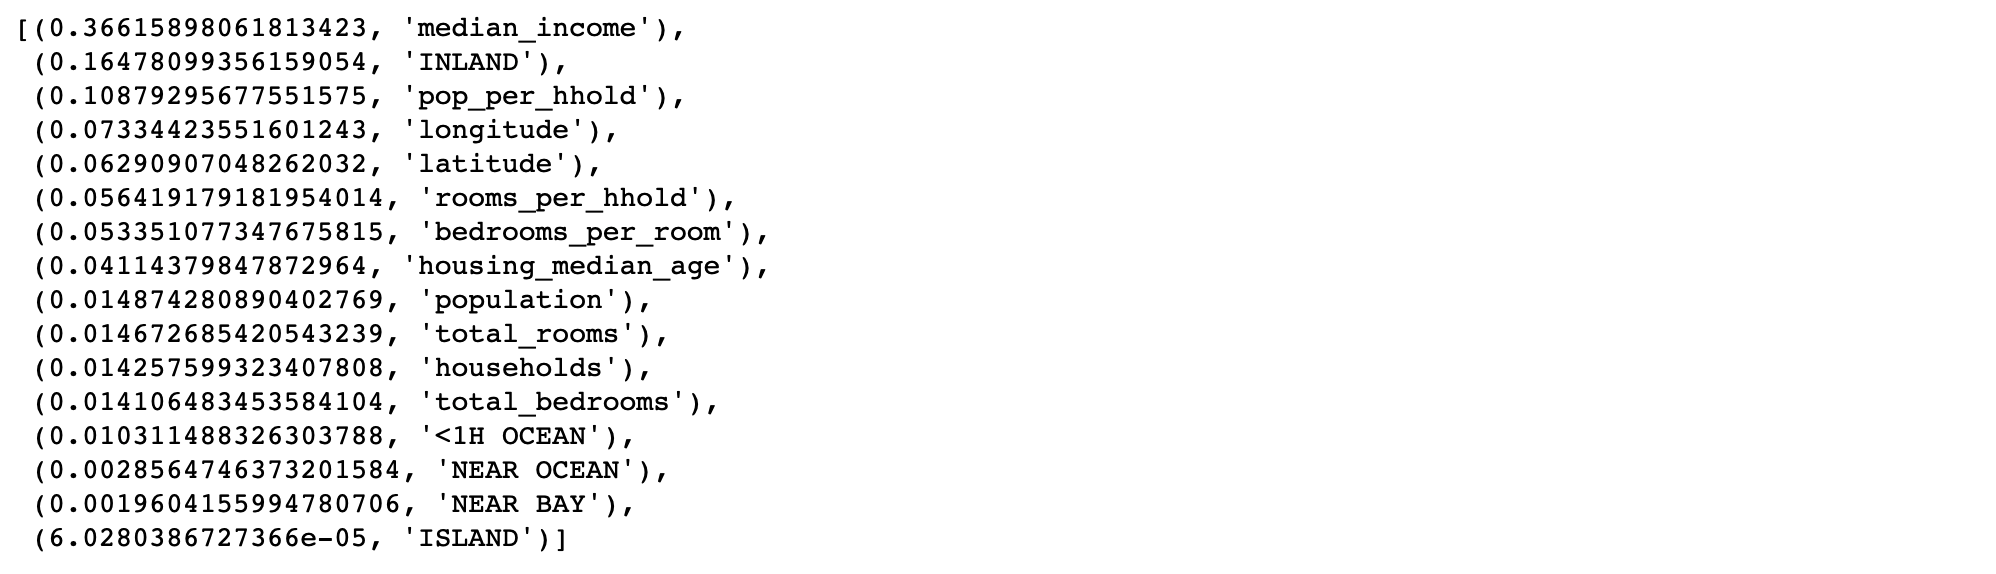
feature_importances = grid_search.best_estimator_.feature_importances_
extra_attribs = ['rooms_per_hhold', 'pop_per_hhold', 'bedrooms_per_room']
cat_encoder = full_pipeline.named_transformers_['cat']
cat_one_hot_attribs = list(cat_encoder.categories_[0])
attributes = num_attribs + extra_attribs + cat_one_hot_attribs
sorted(zip(feature_importances, attributes), reverse=True)
final_model = grid_search.best_estimator_

X_test = strat_test_set.drop('median_house_value', axis=1)
y_test = strat_test_set['median_house_value'].copy()

X_test_prepared = full_pipeline.transform(X_test)
final_predictions = final_model.predict(X_test_prepared)

final_rmse = mean_squared_error(y_test, final_predictions, squared=False)  # 47730.22690385927
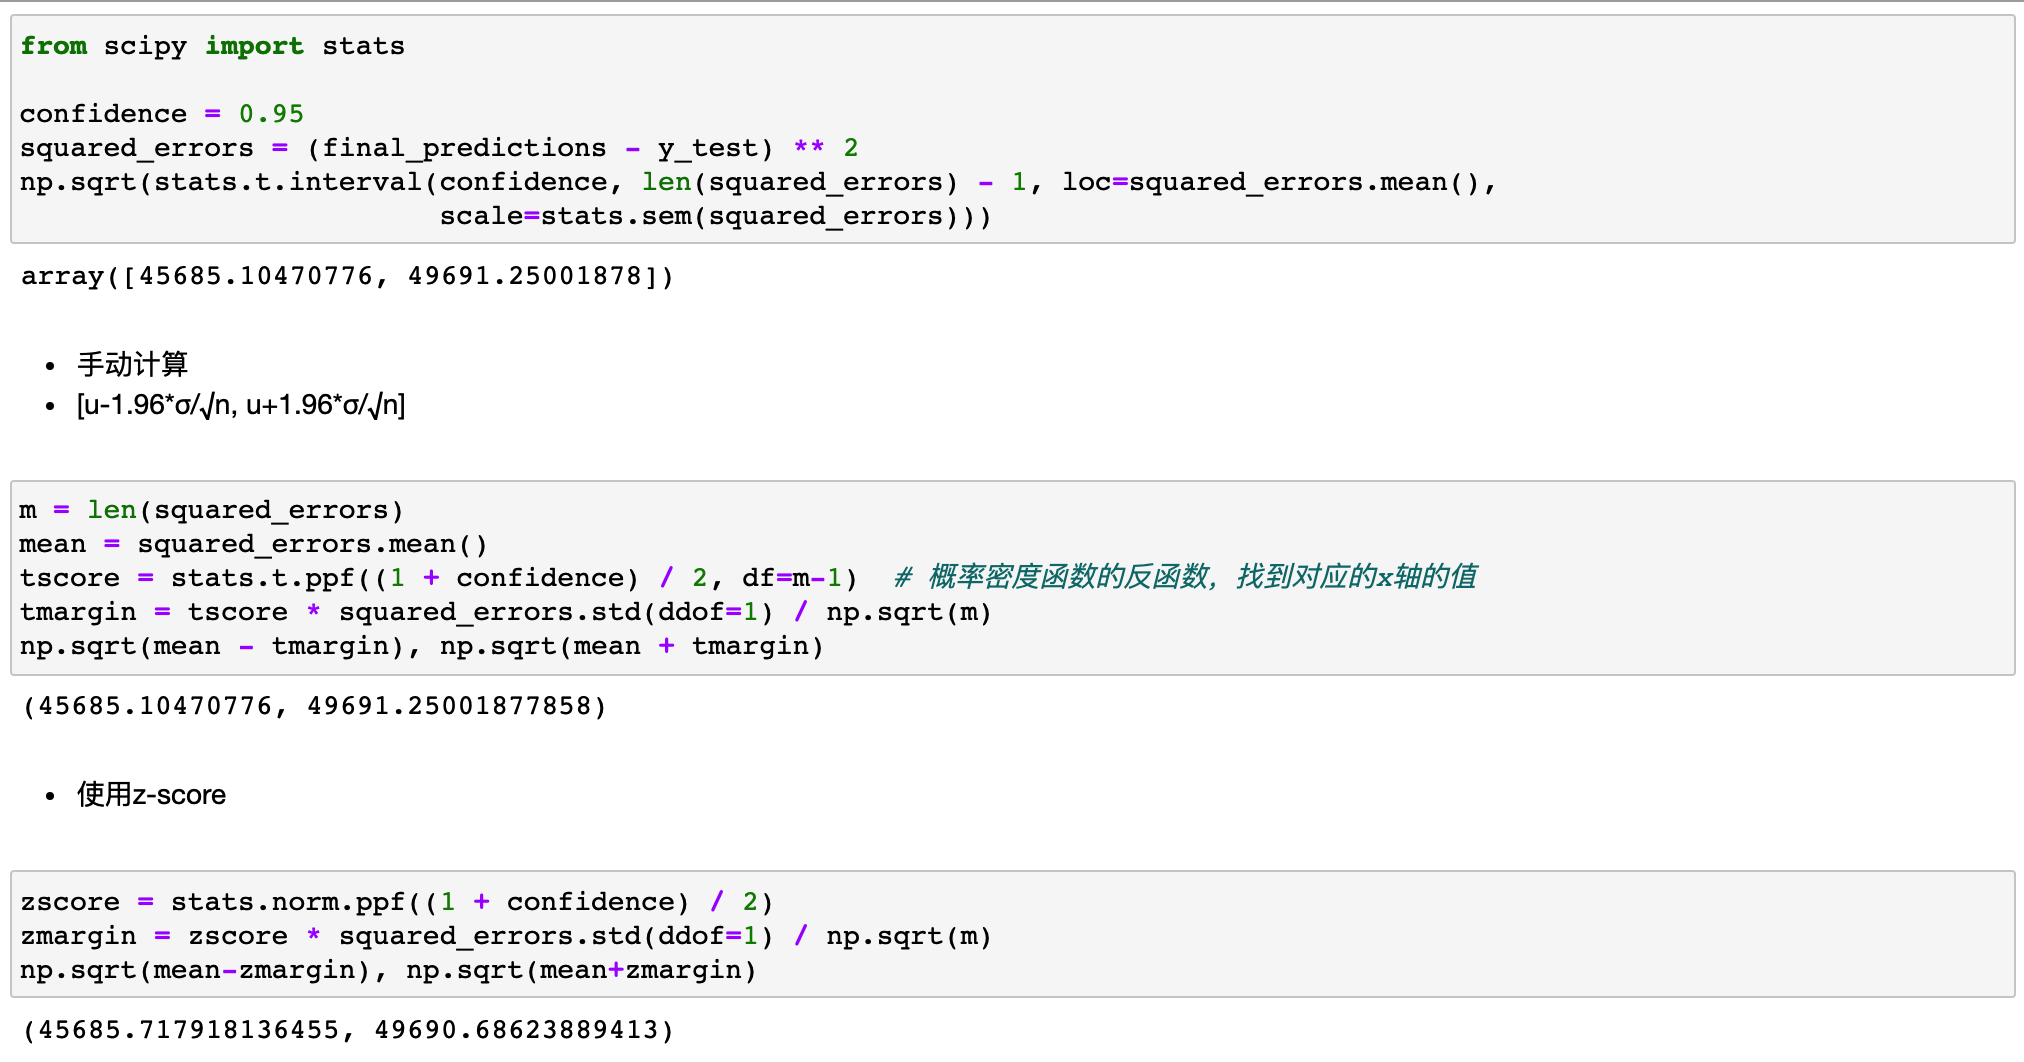
RMSE 的95%置信区间
- interval=stats.t.interval(a,b,mean,std)
- t分布的置信区 间
- a:置信水平
- b:检验量的自由度
- mean:样本均值
- std:样本标准差
模型保存及加载
import joblib

full_pipeline_with_predictor = Pipeline([
    ('preparation', full_pipeline),
    ('rf', final_model)
])
full_pipeline_with_predictor.fit(housing, housing_labels)

joblib.dump(my_model, 'my_model.pkl')
my_model_loaded = joblib.load('my_model.pkl')
# my_model_loaded.predict(some_data)