plt.plot(xnew, y_smooth3_1,color='black',linewidth = '1',label='')
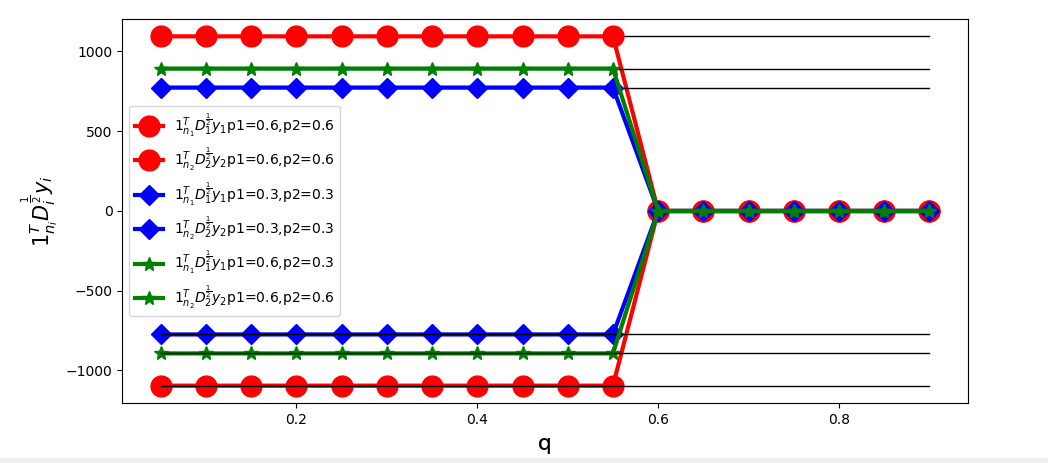
plt.plot(xnew, y_smooth3_2,color='green',linewidth = '3',label=r'$1_{n_1}^TD_{1}^frac{1}{2}y_1$p1=0.6,p2=0.3',markerfacecolor='green',marker='*',markersize=10)
plt.plot(xnew, y_smooth3_3,color='green',linewidth = '3',label=r'$1_{n_2}^TD_{2}^frac{1}{2}y_2$p1=0.6,p2=0.6',markerfacecolor='green',marker='*',markersize=10)
plt.plot(xnew, y_smooth3_4,color='black',linewidth = '1',label='')