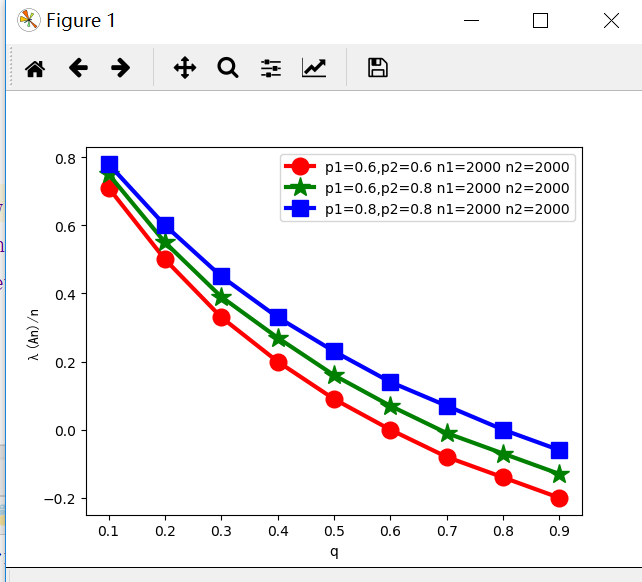

plt.plot(xnew, y_smooth6,color='red',linewidth = '3',label='p1=0.6,p2=0.6 n1=2000 n2=2000',markerfacecolor='red',marker='o',markersize=12)
plt.plot(xnew, y_smooth7,color='green',linewidth = '3',label='p1=0.6,p2=0.8 n1=2000 n2=2000',markerfacecolor='green',marker='*',markersize=15)
plt.plot(xnew, y_smooth8,color='blue',linewidth = '3',label='p1=0.8,p2=0.8 n1=2000 n2=2000',markerfacecolor='blue',marker='s',markersize=12)