上一次的学习了numpy的一些基础操作,今天接着学习numpy的高级索引、轴对换数值转置以及作图。
#花式索引
import numpy as np
'''
t = np.empty((8,4)) #建立一个8行4列的空数组
for i in range(8):
    t[i] = i
'''
#print t
#print t[[4, 3, 0, 6]] 选取特定的行子集
#print t[[-3,-5,-7]]  使用负数从末行开始找
arr =np.arange(32).reshape((8,4))
#print arr[[1,5,7,2], [0,3,1,2]]
#输出的结果是:array([4,23,29,10])。其实是按照(1,0),(5,3),(7,1),(2,2)所找到的
#print arr[[1,5,7,2]][:,[0,3,1,2]]
'''输出结果:
[[ 4  7  5  6]
 [20 23 21 22]
 [28 31 29 30]
 [ 8 11  9 10]]
 形如arr[[]][[]]的索引,第一个[[]]是选出指定的行,
 然后第二个[[]]就如同上面的意思在第一个[[]]选出的
 行中再选出特定值。
 '''
#使用np.ix_函数,同样可以得到以上结果。
#print arr[np.ix_([1,5,7,2], [0,3,1,2])]


#数组转置和轴对换

arr = np.arange(15).reshape((3,5))
#print arr
# T属性是数组中比较特殊的属性,可以将数组的行和列对换。
#print arr.T
arr_1 = np.random.randn(6,3)
# np.dot计算矩阵内积
#print np.dot(arr_1.T, arr_1)
arr_2 = np.arange(24).reshape((2,4,3))
# reshape创建三维数组,是以第一个值为z轴,第二个值为y轴,第三个为x轴。
#print arr_2
# transpose函数中0代表z轴;1代表y轴;2代表x轴。
#print arr_2.transpose((1,0,2))
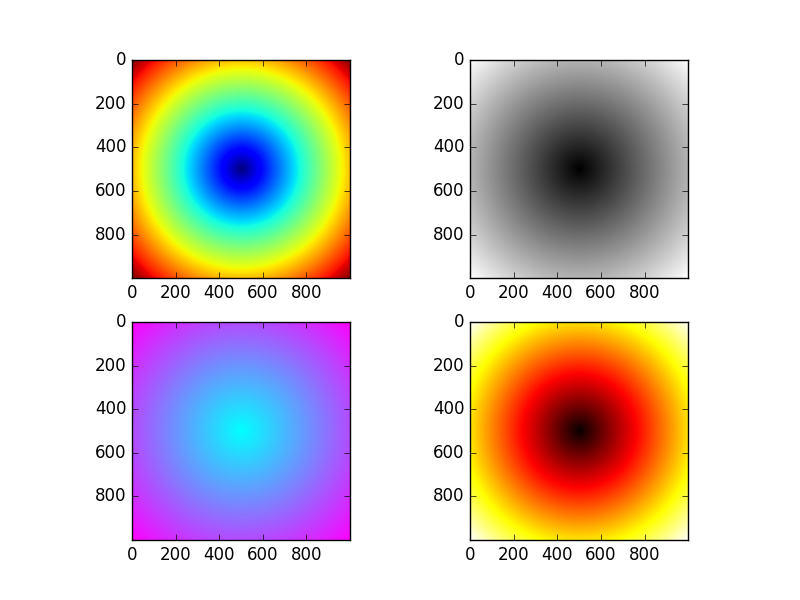
接着作图:
import numpy as np
import matplotlib.pyplot as plt
points = np.arange(-5, 5, 0.01)
#不能将xs和ys分开写!np.meshgrid()接受两个一维数组产生两个二维矩阵((x,y)对)。
xs, ys = np.meshgrid(points, points)
z = np.sqrt(xs ** 2 + ys ** 2)
fig = plt.figure()
ax = fig.add_subplot(221)
ax.imshow(z)
ax = fig.add_subplot(222)
ax.imshow(z, cmap=plt.cm.gray)
ax = fig.add_subplot(223)
ax.imshow(z,cmap=plt.cm.cool)
ax = fig.add_subplot(224)
ax.imshow(z,cmap=plt.cm.hot)
#plt.title("Image plot of $\sqrt{x^2 + y^2}$ for a grid of values")
plt.show()
结果为: