matplotlib是基于Python语言的开源项目,旨在为Python提供一个数据绘图包。使用matplotlib绘图时,必须理解画布(figure),区域(axe)和坐标轴(axis)的区别。figure是画布,而区域axe是画布上的一个子图(subplot),axis是子图上的坐标系。
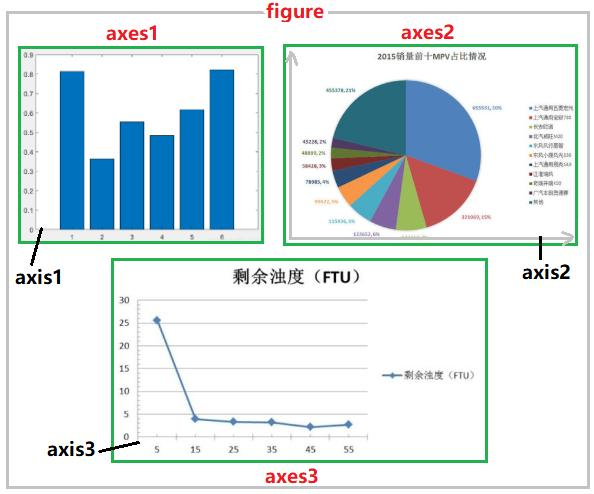
下图显示了figure(画布)、axes(坐标系)、axis(坐标轴)三者之间的关系。
一,导入相关库
导入常用的库,并设置画布的参数:
import numpy as np
import pandas as pd
import matplotlib as mpl
import matplotlib.pyplot as plt

# 排除警告信息
import warnings
warnings.filterwarnings("ignore")

# 打印版本信息
display(np.__version__)
display(pd.__version__)
display(mpl.__version__)

# matplotlib画图常见参数设置
mpl.rcParams["font.family"] = "SimHei" # 设置字体
mpl.rcParams["axes.unicode_minus"]=False # 用来正常显示负号
plt.rcParams['font.sans-serif']=['SimHei'] # 用来正常显示中文标签

# 嵌入式显示图形
%matplotlib inline
二,创建画布
创建画布的方式有显式和隐式两种,本文显式创建画布,添加子图,并设置子图在画布中的位置:
# 手动创建一个figure对象
figure = plt.figure()
# 获取每个位置的axes对象
axes1 = figure.add_subplot(2,1,1)
axes2 = figure.add_subplot(2,1,2)
函数add_subplot()的功能:切分画布,指定当前子图的区域,并返回该区域的引用。

在绘图完成之后,可以通过plt.show() 或者figure.show()把图形显示出来。
举例说明,在一块画布中绘制两个折线图:
figure = plt.figure()
axes1 = figure.add_subplot(2,1,1)
axes2 = figure.add_subplot(2,1,2)

axes1.plot([1,3,5,7],[4,9,6,8])
axes2.plot([1,2,4,5],[8,4,6,2])
plt.show()
参考文档: