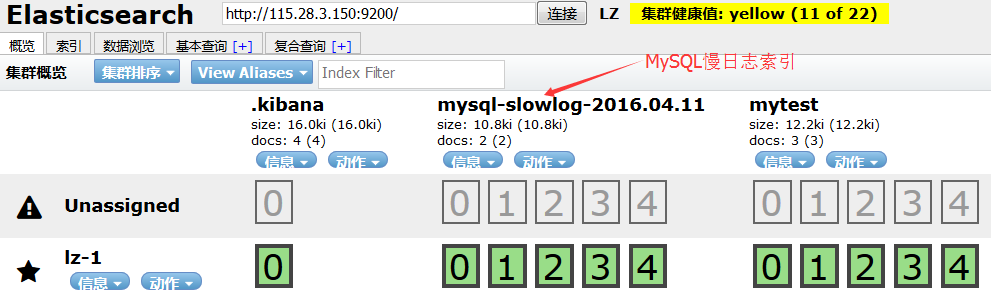

-------------------------------------------------------------------------------------------------------------------------------
cat /usr/local/logstash-2.3.0/config/slowlog.conf
input {
file {
type => "mysql-slow"
path => "/mnt/data/mysql/mysql-slow.log"
start_position => "beginning"
codec => multiline {
pattern => "^# Time:"
negate => true
what => "previous"
}
}
}
filter {
grok {
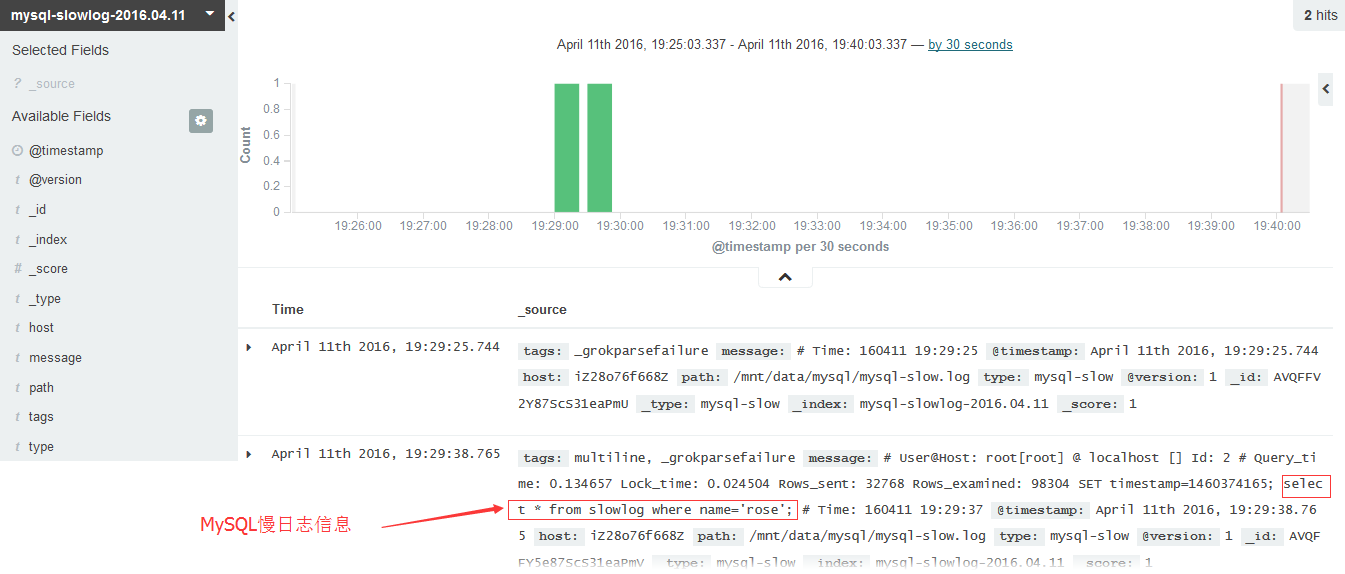
match => { "message" => "SELECT SLEEP" }
add_tag => [ "sleep_drop" ]
tag_on_failure => []
}
if "sleep_drop" in [tags] {
drop {}
}
grok {
match => [ "message", "(?m)^# Time:.*s+# User@Host: %{USER:user}[[^]]+] @ (?:(?<clienthost>S*) )?[(?:%{IP:clientip})?]s*Id: %{NUMBER:id:int}s+# Query_time: %{NUMBER:query_time:float}s+Lock_time: %{NUMBER:lock_time:float}s+Rows_sent: %{NUMBER:rows_sent:int}s+Rows_examined: %{NUMBER:rows_examined:int}s*(?:use %{DATA:database};s*)?SET timestamp=%{NUMBER:timestamp};s*(?<query>(?<action>w+)s+.*)$" ]
}
date {
match => [ "timestamp", "UNIX" ]
remove_field => [ "timestamp" ]
}
}
output {
elasticsearch {
hosts => "192.168.98.163:9200"
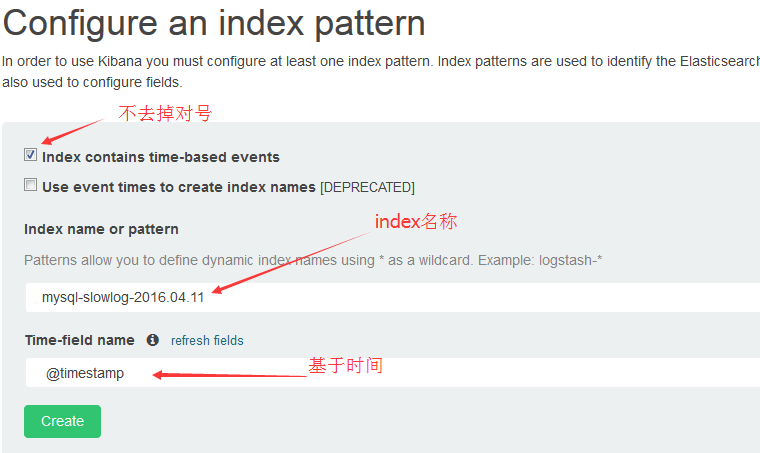
index => "mysql-slowlog"
workers => 1
flush_size => 20000
idle_flush_time => 10
template_overwrite => true
}
}