tpcc-mysql的安装:http://www.cnblogs.com/lizhi221/p/6814003.html
tpcc-mysql的使用:http://www.cnblogs.com/lizhi221/p/6814014.html
前提,已经按照好gnuplot并支持jpeg【直接yum安装即可:yum install gnuplot】
1、使用tpcc-mysql压测数据库,得到压测结果文件
[root@localhost tpcc-mysql]# ./tpcc_start -h127.0.0.1 -P3306 -d sampson -u root -p mysql -w 1 -c 10 -r 60 -l 60 > tpcc-output/tpcc-output-1038.log
[root@localhost tpcc-mysql]# ./tpcc_start -h127.0.0.1 -P3306 -d sampson -u root -p mysql -w 2 -c 10 -r 60 -l 60 > tpcc-output/tpcc-output-1047.log
2、使用tpcc-output-analyze.sh脚本获取压测结果文件中的每次的事务数,并将结果写到制定的TXT文本中
[root@localhost tpcc-mysql]# ./tpcc-output-analyze.sh tpcc-output/tpcc-output-1038.log > tpcc-output/tpcc-1038-data.txt
[root@localhost tpcc-mysql] # cat tpcc-output/tpcc-1038-data.txt
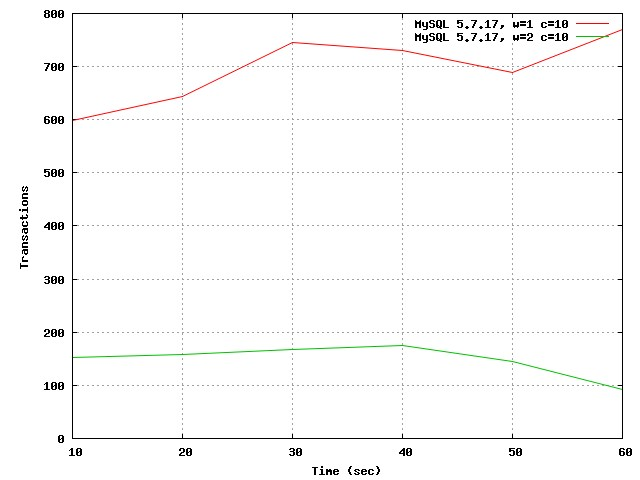
10 599
20 643
30 746
40 730
50 688
60 770
[root@localhost tpcc-mysql]# ./tpcc-output-analyze.sh tpcc-output/tpcc-output-1047.log > tpcc-output/tpcc-1047-data.txt
[root@localhost tpcc-mysql] # cat tpcc-output/tpcc-1047-data.txt
10 153
20 159
30 168
40 175
50 145
60 93
3、将两个文本合并
[root@localhost tpcc-mysql]# paste tpcc-output/tpcc-1038-data.txt tpcc-output/tpcc-1047-data.txt > tpcc-output/tpcc-graph-data-0504.txt
[root@localhost tpcc-mysql] # cat tpcc-output/tpcc-graph-data-0504.txt
10 599 10 153
20 643 20 159
30 746 30 168
40 730 40 175
50 688 50 145
60 770 60 93
4、使用tpcc-graph-build.sh脚本生成图表
[root@localhost tpcc-mysql]#./tpcc-graph-build.sh tpcc-output/tpcc-graph-data-0504.txt tpcc-output/tpcc-graph-0504.jpg
注:
plot datafile using 1:2 title "MySQL 5.7.17, w=1 c=10" with lines,
datafile using 3:4 title "MySQL 5.7.17, w=2 c=10" with lines axes x1y1
【这里的using对应tpcc-graph-data-0504.txt的列,using 1:2即使用1、2列 】
图表显示:
[root@localhost tpcc-mysql] # cat tpcc-output-analyze.sh
#!/bin/sh
TIMESLOT=1
if [ -n "$2" ]
then
TIMESLOT=$2
fi
cat $1 | grep -v HY000 | grep -v payment | grep -v neword | awk -v timeslot=$TIMESLOT 'BEGIN { FS="[,():]"; s=0; cntr=0; aggr=0 } /MEASURING START/ { s=1} /STOPPING THREADS/ {s=0} /0/ { if (s==1) { cntr++; aggr+=$2; } if ( cntr==timeslot ) { printf ("%d %3d
",$1,(aggr/timeslot)) ; cntr=0; aggr=0 } }'
[root@localhost tpcc-mysql] # cat tpcc-graph-build.sh
#!/bin/bash

### goto user homedir and remove previous file
rm -f '$2'

gnuplot << EOP

### set data source file
datafile = '$1'

### set graph type and size
set terminal jpeg size 640,480

### set titles
set grid x y
set xlabel "Time (sec)"
set ylabel "Transactions"

### set output filename
set output '$2'

### build graph
# plot datafile with lines
plot datafile using 1:2 title "MySQL 5.7.17, w=1 c=10" with lines,
datafile using 3:4 title "MySQL 5.7.17, w=2 c=10" with lines axes x1y1

EOP
