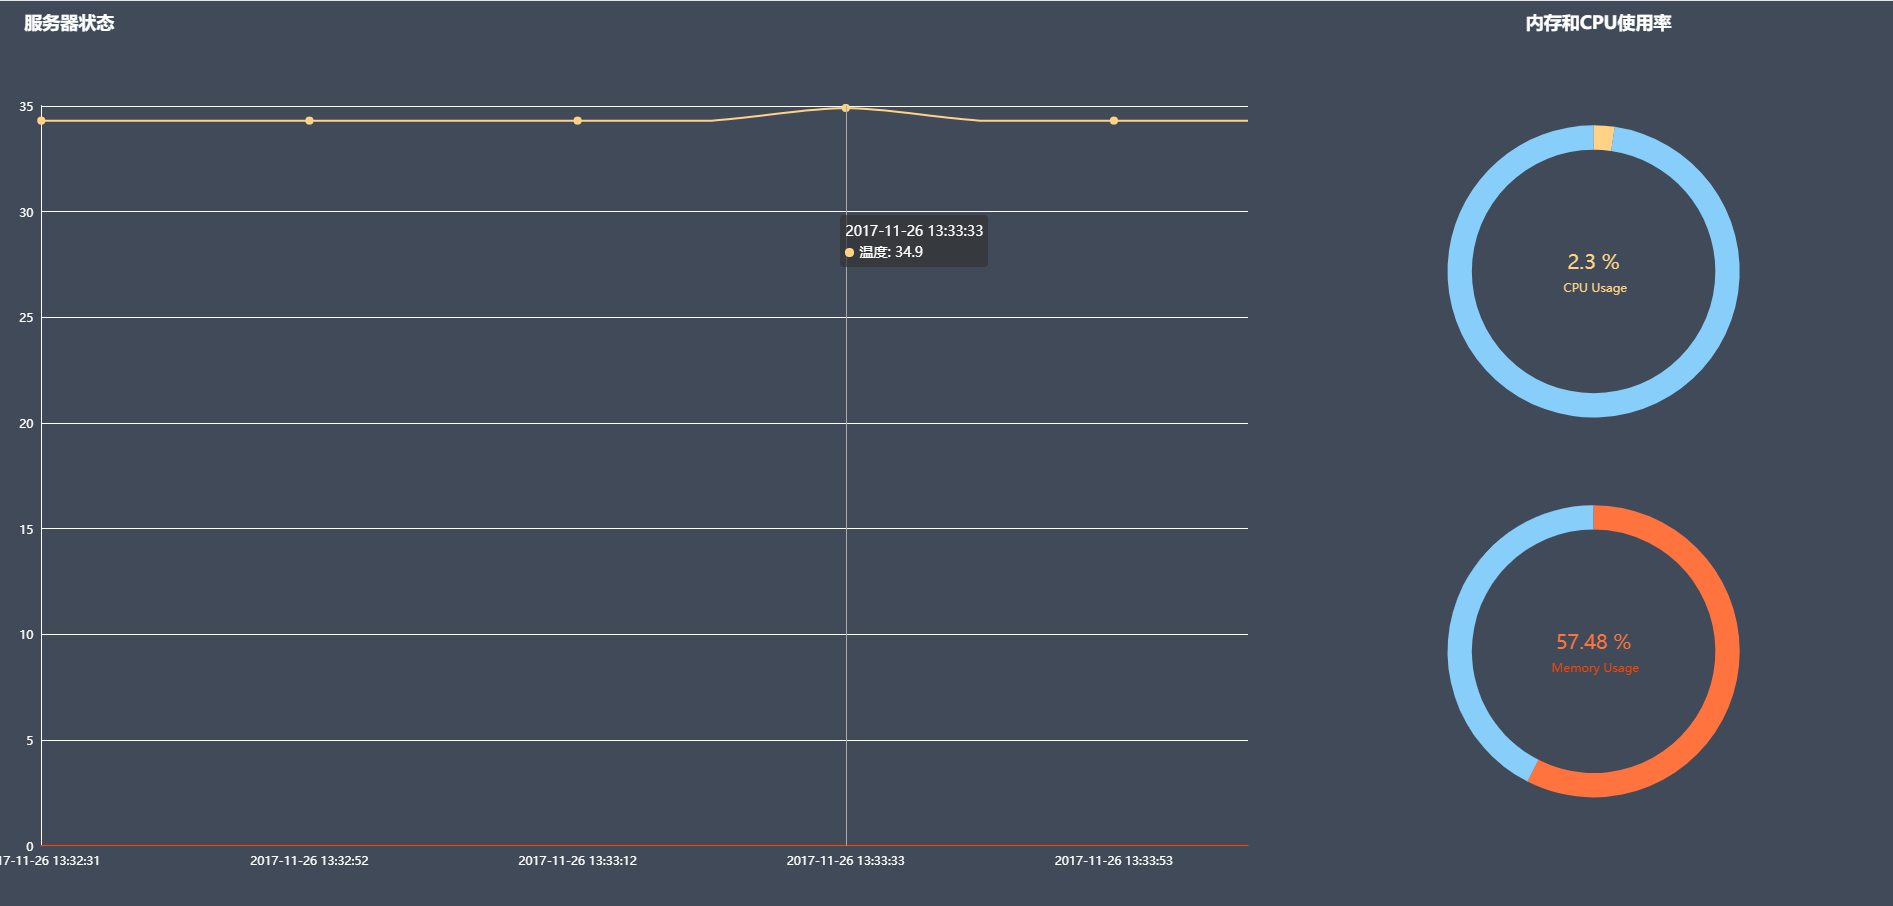
echarts中的图表大小自适应

echarts中的图表大小自适应


  1 <div id="serverStatus"></div>
  2     <script type="text/javascript">
  3         var worldMapContainer = document.getElementById('serverStatus');
  4 
  5         var resizeWorldMapContainer = function () {
  6             worldMapContainer.style.width = window.innerWidth+'px';
  7             worldMapContainer.style.height = window.innerHeight+'px';
  8         };
  9         resizeWorldMapContainer();
 10 
 11         // 基于准备好的dom,初始化echarts实例
 12         var myChart = echarts.init(worldMapContainer);
 13 
 14         // 指定图表的配置项和数据
 15         setInterval(function () {
 16             $.ajax({
 17                 url:'/data',
 18                 type:'get',
 19                 dataType:'json',
 20                 success:function (data) {
 21                     var option = {
 22                         backgroundColor: "#404A59",
 23                         color: ['#ffd285', '#ff733f', '#ec4863'],
 24 
 25                         title: [
 26                             {
 27                                 text: '服务器状态',
 28                                 left: '1%',
 29                                 top: '6%',
 30                                 textStyle: {color: '#fff'}
 31                             },
 32                             {
 33                                 text: '内存和CPU使用率',
 34                                 left: '83%',
 35                                 top: '6%',
 36                                 textAlign: 'center',
 37                                 textStyle: {color: '#fff'}
 38                             }
 39                         ],
 40 
 41                         tooltip: {trigger: 'axis'},
 42                         legend: {
 43                             x: 300,
 44                             //top: '7%',
 45                             top: '2%',
 46                             textStyle: {color: '#ffd285',},
 47                             //data: ['温度', '湿度', '压力']
 48                             data: data.legend
 49                         },
 50                         grid: {
 51                             left: '1%',
 52                             right: '35%',
 53                             top: '16%',
 54                             bottom: '6%',
 55                             containLabel: true
 56                         },
 57                         toolbox: {
 58                             "show": false,
 59                             feature: {
 60                                 saveAsImage: {}
 61                             }
 62                         },
 63 
 64                         // X轴
 65                         xAxis: {
 66                             //type: 'category',
 67                             "axisLine": {
 68                                 lineStyle: {
 69                                     color: '#FF4500'
 70                                 }
 71                             },
 72                             "axisTick": {
 73                                 "show": false
 74                             },
 75                             axisLabel: {
 76                                 textStyle: {
 77                                     color: '#fff'
 78                                 }
 79                             },
 80                             boundaryGap: false,
 81 
 82                             // 可以从数据库中获取当前时间段
 83                             //data: ['08:00', '09:00', '10:00', '11:00', '12:00', '13:00', '14:00','15:00','16:00','17:00', '18:00', '19:00','20:00','21:00', '23:00','00:00','01:00', '02:00', '03:00', '04:00', '05:00', '06:00', '07:00']
 84                             data: data.categories
 85                         },
 86                         // Y轴
 87                         yAxis: {
 88                             "axisLine": {
 89                                 lineStyle: {
 90                                     color: '#fff'
 91                                 }
 92                             },
 93                             splitLine: {
 94                                 show: true,
 95                                 lineStyle: {
 96                                     color: '#fff'
 97                                 }
 98                             },
 99                             "axisTick": {
100                                 "show": false
101                             },
102                             axisLabel: {
103                                 textStyle: {
104                                     color: '#fff'
105                                 }
106                             },
107                             type: 'value'
108                         },
109 
110                         series: [
111                             // 四条曲线
112                             {
113                                 name: '温度',
114                                 smooth: true,
115                                 type: 'line',
116                                 symbolSize: 8,
117                                 symbol: 'circle',
118                                 //data: [90,90, 50, 39, 50, 20, 82, 80,90,10, 20, 39, 50, 120, 82, 80,90, 300, 39, 80, 120, 82, 80,90],
119                                 data: data['temperature']
120                             },
121                             {
122                                 name: '湿度',
123                                 smooth: true,
124                                 type: 'line',
125                                 symbolSize: 8,
126                                 symbol: 'circle',
127                                 //data: [90,90, 50, 39, 50, 120, 82, 80,90,100, 50, 99, 200, 120, 82, 80,90, 50, 39, 50, 120, 82, 80,90],
128                                 data: data['humidity']
129                             },
130                             {
131                                 name: '压力',
132                                 smooth: true,
133                                 type: 'line',
134                                 symbolSize: 8,
135                                 symbol: 'circle',
136                                 //data: [290, 200,20, 132, 15, 200, 90,200,150, 200,20, 132, 15, 200, 90,200,150, 200,20, 132, 15, 200, 90,200],
137                                 data: data['pressure']
138                             },
139 
140                             // 两个饼图
141                             {
142                                 type: 'pie',
143                                 center: ['83%', '33%'],
144                                 radius: ['25%', '30%'],
145                                 label: {
146                                     normal: {
147                                         position: 'center'
148                                     }
149                                 },
150                                 data: [{
151                                     //value: 50,
152                                     value: data['cpuUsage'],
153                                     name: 'cup使用',
154                                     itemStyle: {
155                                         normal: {
156                                             color: '#ffd285'
157                                         }
158                                     },
159                                     label: {
160                                         normal: {
161                                             formatter: '{d} %',
162                                             textStyle: {
163                                                 color: '#ffd285',
164                                                 fontSize: 20
165 
166                                             }
167                                         }
168                                     }
169                                 }, {
170                                     value: data['cpuNotUsage'],
171                                     name: 'cpu未使用',
172                                     tooltip: {
173                                         show: false
174                                     },
175                                     itemStyle: {
176                                         normal: {
177                                             color: '#87CEFA'
178                                         }
179                                     },
180                                     label: {
181                                         normal: {
182                                             textStyle: {
183                                                 color: '#ffd285',
184                                             },
185                                             formatter: '
 CPU Usage'
186                                         }
187                                     }
188                                 }]
189                             },
190                             {
191                                 type: 'pie',
192                                 center: ['83%', '72%'],
193                                 radius: ['25%', '30%'],
194                                 label: {
195                                     normal: {position: 'center'}
196                                 },
197                                 data: [
198                                     {
199                                         //value: 50,
200                                         value: data['memUsage'],
201                                         name: '使用',
202                                         itemStyle: {
203                                             normal: {color: '#ff733f'}
204                                         },
205                                         label: {
206                                             normal: {
207                                                 formatter: '{d} %',
208                                                 textStyle: {
209                                                     color: '#ff733f',
210                                                     fontSize: 20
211                                                 }
212                                             }
213                                         }
214                                     },
215 
216                                     {
217                                         //value: 510,
218                                         value: data['memNotUsage'],
219                                         name: '未使用',
220                                         tooltip: {show: false},
221                                         itemStyle: {
222                                             normal: {color: '#87CEFA'}
223                                         },
224                                         label: {
225                                             normal: {
226                                                 textStyle: {color: '#FF4500',},
227                                                 formatter: '
 Memory Usage'
228                                             }
229                                         }
230                                     }
231                                 ]
232                             }
233                         ]
234                     };
235                     myChart.setOption(option)
236                 }
237             });
238         },1000)
239 
240         window.onresize = function () {
241             resizeWorldMapContainer();
242             myChart.resize();
243         };
原文地址:https://www.cnblogs.com/liyugeng/p/7898851.html