在游戏行业,次日留存率是个很重要的指标,对于评价一款游戏的优劣具有很重要的参考价值。
下面先看以下相关的定义:
用户留存:统计时间区间内,新登用户在随后不同时期的登录使用情况。
日次留存率:日新登用户在次日( 不含首次登录当天) 登录的用户数占新登用户比例。
解决问题:
1、用户对于游戏的适应性如何;
2、评估渠道用户质量;
3、投放渠道效果评估;
4、用户对于游戏的粘性如何;
5、新登用户什么时期流失会加剧。
(以上内容来自TalkingData的《移动游戏运营数据分析指标白皮书》)
可以看出,次日留存率主要关注的是在某一日(比如2013-8-25)新登录的用户,在第二天(即2013-8-26)登录的用户数占昨日(2013-8-25)新登用户比例的情况。
接着来看“生命周期第N天上线率”的定义:
统计时间区间内,所有用户在游戏生命周期第N天登录的用户数占所有用户的比例。
解决问题:
次日留存率能解决的问题,该指标都沾些边。但该指标的主要用途还是在评价某些游戏运营过程中设置的“连续登陆送奖励”等类似策略的有效性。
下面就用一个例子来演示下如何通过SAS求出这两个指标值。
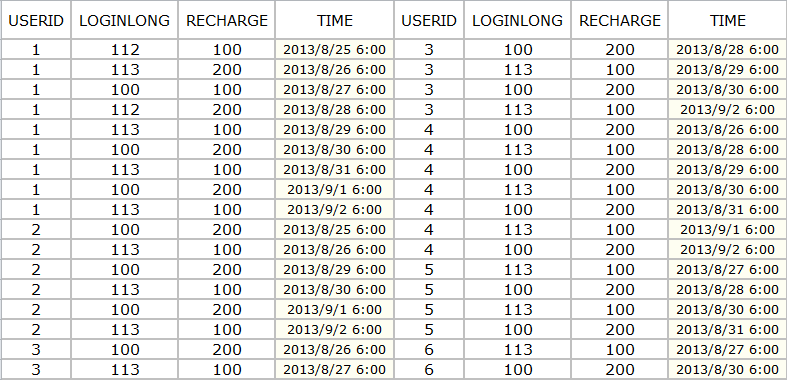
数据如下(USERID:用户ID;LOGINLONG:登陆时长(S);RECHARGE:充值金额;TIME:登录时间):
程序如下:
***导入数据***;
proc import out=test datafile="H:\test.xls" dbms=excel replace;
    sheet="sheet1$";
    mixed=yes ;
    scantext=yes;
run;

***计算生命周期第2天上线率***;
proc sort data=test;by userid time;run;

proc means data=test nway noprint;
    class userid;
    var time;
    output out=minmax(keep=userid min_time max_time) min=min_time max=max_time;
run;

data minmax;
    set minmax;
    format time date9.;
    do time=min_time to max_time;
        output;
    end;
    drop min_time max_time;
run;

data temp;
    merge minmax(in=a) test;
    by userid time;
    if a;
run;

data temp;
    set temp;
    if loginlong=. or recharge=. then login=0;else login=1;
    by userid;
    if first.userid then timeline=1;
    else timeline+1;
run;

%macro timeline;

proc sql noprint;
    select count(distinct timeline) into:num
    from temp;
quit;

%do i=1 %to #

    proc sql noprint;
        create table temp1 as
        select timeline,count(distinct userid) as tnum
        from temp
        where timeline=&i and login=1;
    quit;

    proc datasets nolist;
        append base=temp2 data=temp1;
        delete temp1;
    quit;

%end;

data result1;
    set temp2;
    by timeline;
    if first.timeline then output;
run;

proc datasets nolist;delete temp2 minmax;quit;run;

%mend;

%timeline;

data _null_;
    set result1;
    if _n_=1 then do;
        call symputx('snum',tnum);
    end;
run;

data result1;
    set result1;
    format rate 5.2;
    rate=tnum/&snum.*100;
    label timeline='游戏生命周期第N天' tnum='上线人数' rate='生命周期第N天上线率(%)';
run;

***计算次日留存率***;
proc sql;
    create table temp1 as
    select time,count(distinct userid) as new_tnum
    from temp
    where timeline=1
    group by time;

    create table temp2 as
    select time-1 as time,count(distinct userid) as mnum
    from temp
    where login=1 and timeline=2
    group by time;
quit;

data result2;
    merge temp1 temp2;
    format time date9.;
    by time;
run;

data result2;
    set result2;
    rate=mnum/new_tnum*100;
    label time='日期' new_tnum='新增用户数' rate='次日留存率(%)';
    drop mnum;
run;

proc datasets nolist;delete temp temp1 temp2;quit;run;
结果:
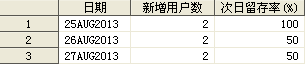
(1)次日留存率
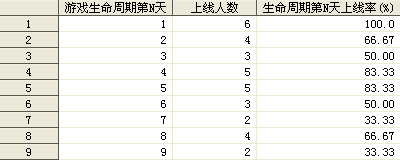
(2)生命周期第N天上线率
p.s.:因为是测试程序用的数据,所以谈不上通过数据可视化来发现某些有价值的东西。但至少提供了一个可行的方向。如果有真实的游戏数据来做测试,或许可以发现一些有趣的现象。一般来说,生命周期第N天上线率与传统意义上的留存率是存在相关关系的。一般不会出现一款游戏的次日留存率节节走高,而生命周期第2天上线率下降的现象。