双Y轴刻度线对齐
// 手动计算两边y轴的间隔和最大值
{
                    max: Math.ceil(Math.max.apply(Math, arr)/3)*3,
                    interval: Math.ceil(Math.max.apply(Math, arr)/3)
}
// options 配置,y轴部分
yAxis: [
    {
        type: 'value',
        name: '数量',
        min: 0,
        splitNumber: 3,
        interval: lInterval,
        max: lMax,
      ...
    },
    {
        type: 'value',
        name: '处理率',
        min: 0,
        splitNumber: 3,
        max: rMax,
        interval: rInterval,
      ...
    },
],
tooltip 格式化
options = {
   tooltip: {
            trigger: 'axis',
            axisPointer: {
                type: 'line',
                lineStyle: {
                    color: '#99CFFF'
                }
            },
       // 官网示例,使tooltips位置不超出
            position: function (pos, params, el, elRect, size) {
                let obj = {top: 10};
                obj[['left', 'right'][+(pos[0] < size.viewSize[0] / 2)]] = 30;
                return obj;
            },
            formatter(params) {
                let name = ''
                const list = params.map((item, index) => {
                    if(!name) name = item.name;
                    return `
            <span style="display: inline-block;  5px; height: 5px; border-radius: 50%; background-color: ${item.color}"></span>
            <span style="display: inline-block; color: #fff; font-size: 10px;">${item.seriesName}:${item.value}${index > 1 && '%' || ''}</span>`
                }).splice(0,4);
                return  '<div style="padding-left: 10px;">' + name + '</div>' + list.join('<br>');
            },
        },
...
}
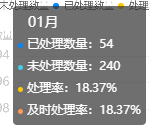
效果图展示
图例ICON默认圆的半径更改
调整默认图例icon大小的办法
options = {
 legend: {
            left: 0,
            itemHeight: 6,
            itemWidth: 6,
            itemGap: 4,
            icon: 'circle',
            textStyle: {
                fontSize: 10,
                color: '#666'
            },
            data: ['未处理数量', '已处理数量', '处理率', '及时处理率'],
        }
...
}
效果展示

渐变色折线图的处理
         {
                name: '',
                type: 'line',
                yAxisIndex: 1,
                itemStyle: {
                    color: '#FFC800'
                },
                areaStyle: {
                    color: {
                        type: 'linear',
                        x: 0,
                        y: 0,
                        x2: 0,
                        y2: 1,
                        colorStops: [{
                            offset: 0, color: 'rgba(255,200,4,0.4)' // 0% 处的颜色
                        }, {
                            offset: 1, color: 'rgba(255,200,4,0)' // 100% 处的颜色
                        }],
                    }
                },
                data
            }
效果

环形图中间定义内容的方法,同时保留自己的label

主要思路,
中间内容为背景白色的第二个饼图,然后自定义第二个饼图的label即可,arrow为base64图片
{
        name,
        type: 'pie',
        selectedMode: 'single',
        avoidLabelOverlap: false,
        label: {
            position: 'center',
            color: '#323232',
            formatter: '{a|{a}
}{arrow|}{c|{c}%
}{b|{b}}',
            rich: {
                a: {
                    fontSize: 10,
                    color: '#999',
                    lineHeight: 14,
                },
                c: {
                    color: '#323232',
                    fontSize: 24,
                    fontWeight: 'bold',
                    verticalAlign: 'middle',
                },
                arrow: {
                    align: 'center',
                    verticalAlign: 'middle',
                    height: 14,
                    backgroundColor: {
                        image: arrowImg
                    },
                },
                b: {
                    fontSize: 10,
                    color: '#999',
                    lineHeight: 14,
                },
            }
        },
        labelLine: {
            show: false
        },
        selectedOffset: 0,
        hoverAnimation: false,
        radius: [0, '40%'],//填满中心的圆
        tooltip: {
            show: false
        },
        data: [
            {
                value: value || '--',
                name: txt,
                itemStyle: {
                    color: '#fff'
                }
            }
        ]
    }