------------恢复内容开始------------
1.绘制简单的折线图,效果图如下
import matplotlib.pyplot as plt
#使用平方数据来绘制表格
input_values=[1,2,3,4,5]
squars=[1,4,9,6,25]
#修改标签和文字线条粗细,linewidth 表示粗细
plt.plot(input_values,squars,linewidth=5)

#设置图标的标题,并且给坐标轴加上标签
plt.title("Title",fontSize=20)
plt.xlabel("X title",fontSize=16)
plt.ylabel("Y title",fontSize=15)
#设置刻度标记的大小
plt.tick_params(axis='both',labelsize=14)
plt.show()

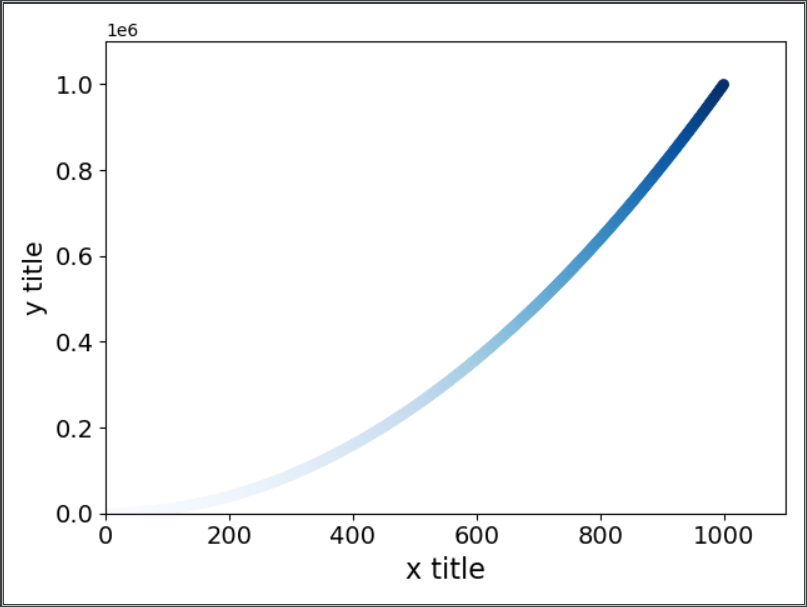
2.绘制简单的,效果图如下
import matplotlib.pyplot as plt
# 使用Scatter 绘制散点图,自动计算坐标轴的范围
x_values=list(range(1,1001))
y_values=[x**2 for x in x_values]

# 删除数据点的轮廓,c 表示颜色,c将较浅的颜色显示较小的值,颜色映射
plt.scatter(x_values,y_values,c=y_values,cmap=plt.cm.Blues,edgecolor='none',s=40)
plt.xlabel("x title",fontSize=16)
plt.ylabel("y title",fontSize=15)
#设置刻度标记的大小
plt.tick_params(axis='both',labelsize=14)
# 设置坐标轴的取值范围
plt.axis([0,1100,0,1100000])
plt.show()
#保存图片
plt.savefig("D:\2.png",bbox_inches='tight')
#第一个参数保存的是位置,第二个是空白区域去掉
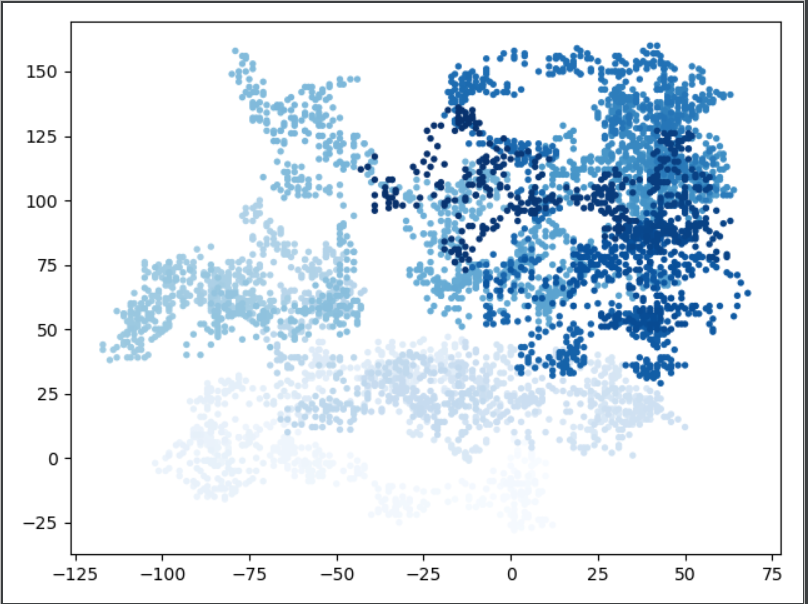
3.绘制漫步图
# 漫步数据的类
import  matplotlib.pyplot as plt
from random import choice
class Randomwalk():
    #一个生成随机漫步数据的类
    def __init__(self,num_points=5000):
        #初始化随机漫步的属性
        self.num_points=num_points
        #所有漫步都从0开始
        self.x_values=[0]
        self.y_values=[0]
    def fill_walk(self):
        #不断漫步,直到列表表达的长度
        while len(self.x_values)<self.num_points:
            #决定前进方向以及沿着这个方向前进的距离
            x_direction=choice([1,-1])
            x_distance=choice([0,1,2,3,4])
            x_step=x_direction*x_distance
            y_direction=choice([1,-1])
            y_distance = choice([0, 1, 2, 3, 4])
            y_step = y_direction * y_distance
            #拒绝原地踏步
            if x_step==0 and y_step==0:
                continue
            #计算下一个点X和y 的值
            next_x=self.x_values[-1]+x_step
            next_y=self.y_values[-1]+y_step
            self.x_values.append(next_x)
            self.y_values.append(next_y)

#只要程序处于活动状态就模拟
while True:
 rw=Randomwalk()
 rw.fill_walk()
 #生成一个数字列表,包含数字个数与漫步包含的点数相同
 point_numbers=list(range(rw.num_points))
 #给点着色
 plt.scatter(rw.x_values,rw.y_values,c=point_numbers,cmap=plt.cm.Blues,edgecolors='none',s=15)
 plt.show()
 keep_running=input("Make another walk?(y/n):")
 if keep_running=='n':
     break
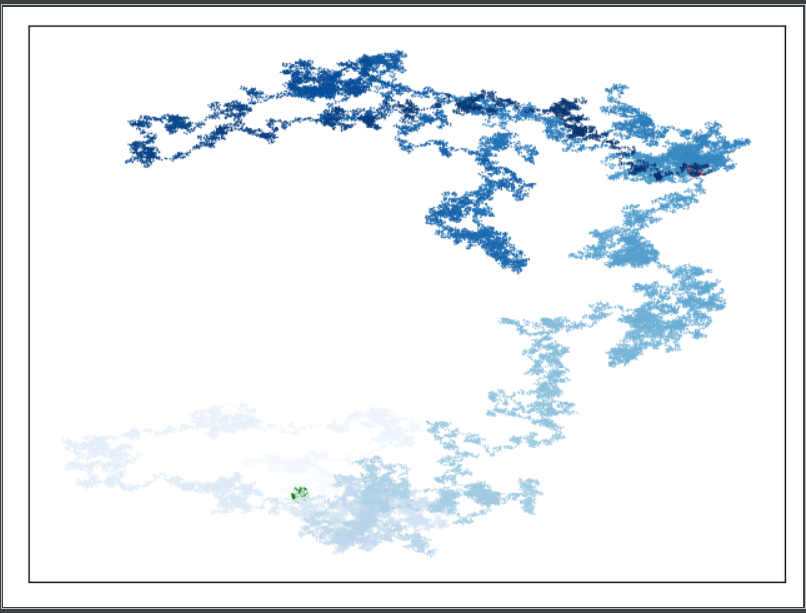
4.漫步方法同上,隐藏坐标轴
# 漫步数据的类
import  matplotlib.pyplot as plt
from random import choice
class Randomwalk():
    def __init__(self,num_points=5000):
        self.num_points=num_points
        #所有漫步都从0开始
        self.x_values=[0]
        self.y_values=[0]
    def fill_walk(self):
        #不断漫步,只到长度
        while len(self.x_values)<self.num_points:
            x_direction=choice([1,-1])
            x_distance=choice([0,1,2,3,4])
            x_step=x_direction*x_distance
            y_direction=choice([1,-1])
            y_distance = choice([0, 1, 2, 3, 4])
            y_step = y_direction * y_distance
            #拒绝原地踏步
            if x_step==0 and y_step==0:
                continue
            #计算下一个点X和y 的值
            next_x=self.x_values[-1]+x_step
            next_y=self.y_values[-1]+y_step
            self.x_values.append(next_x)
            self.y_values.append(next_y)

#只要程序处于活动状态就模拟
while True:
 rw=Randomwalk(50000)
 rw.fill_walk()
 point_numbers=list(range(rw.num_points))
#突出起点和终点
 plt.scatter(0,0,c='green',edgecolors='none',s=100)
 plt.scatter(rw.x_values[-1],rw.y_values[-1],c='red',edgecolors='none',s=100)
 plt.scatter(rw.x_values, rw.y_values, c=point_numbers, cmap=plt.cm.Blues,edgecolors='none', s=1)
 #隐藏坐标轴
 plt.axes().get_xaxis().set_visible(False)
 plt.axes().get_yaxis().set_visible(False)
 plt.show()
 keep_running=input("Make another walk?(y/n):")
 if keep_running=='n':
     break
------------恢复内容结束------------