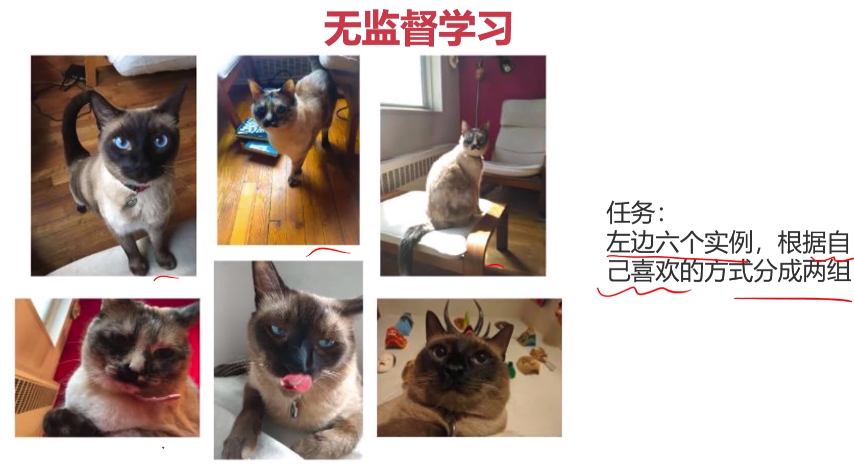
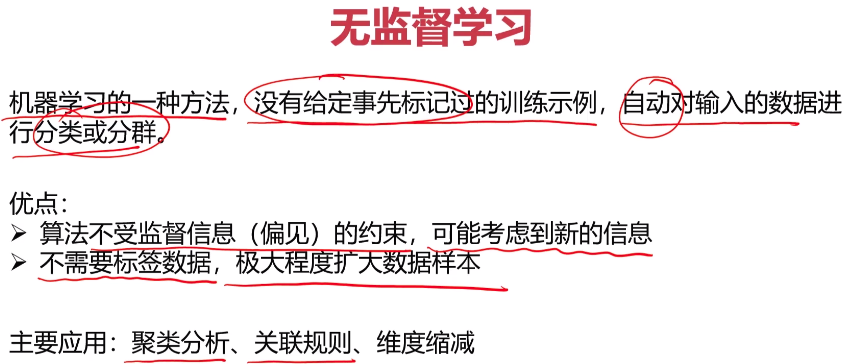
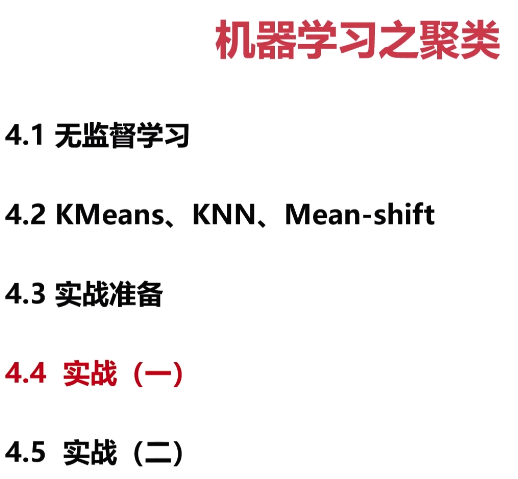
- 无监督学习


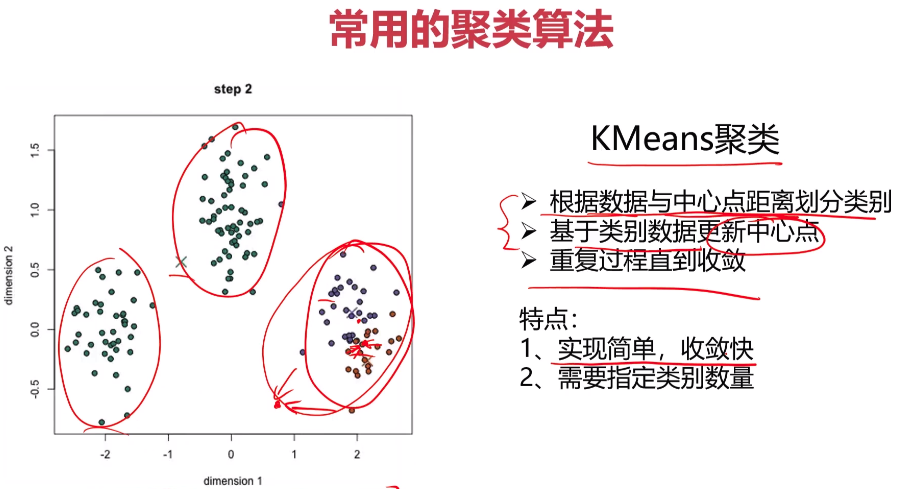
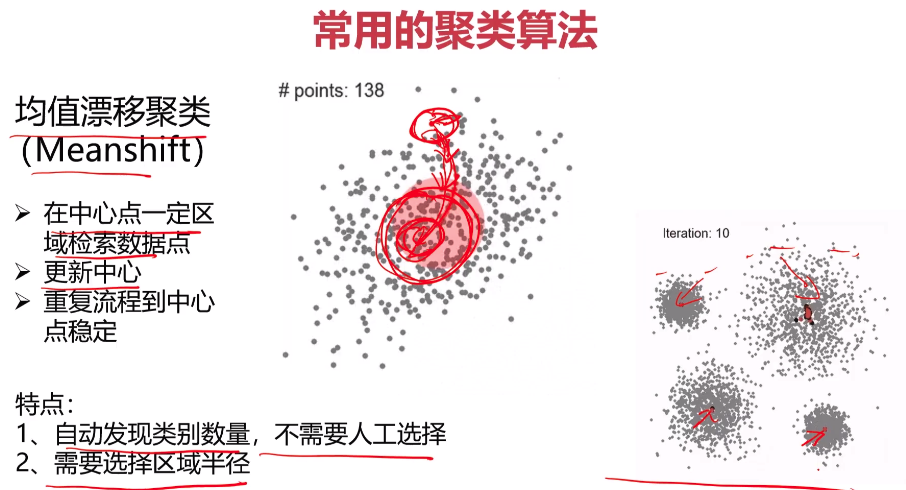

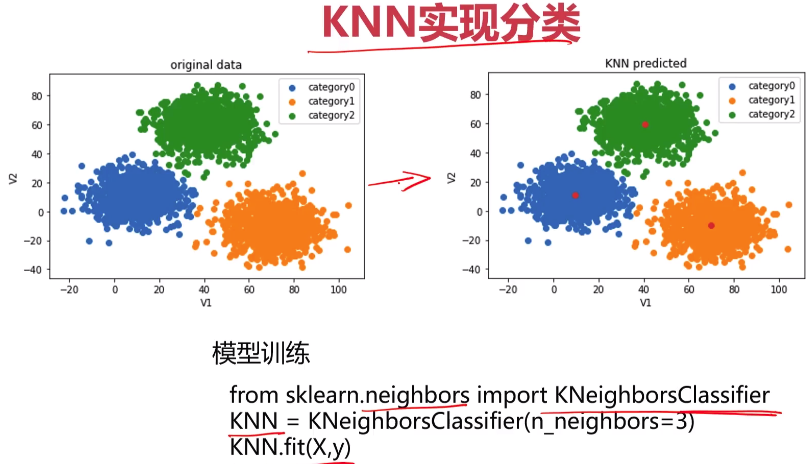
- Kmeans-KNN-Meanshift
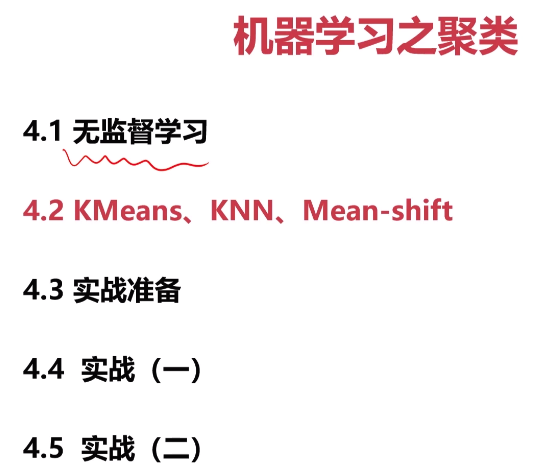

- 实战准备

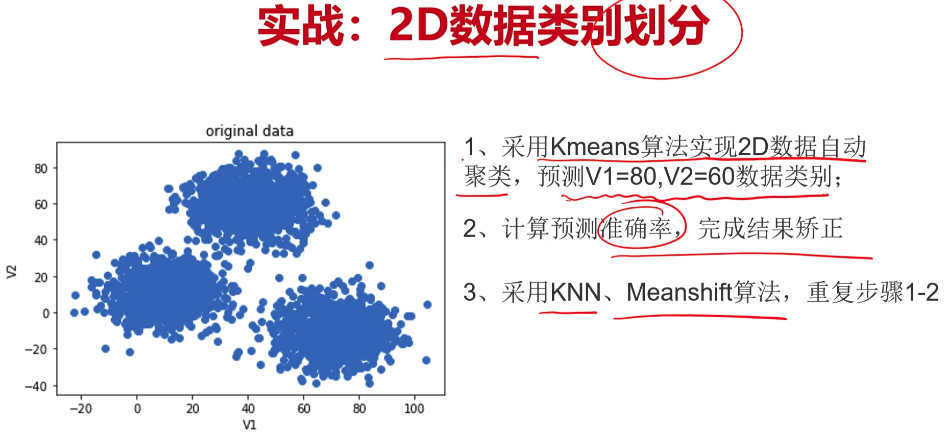
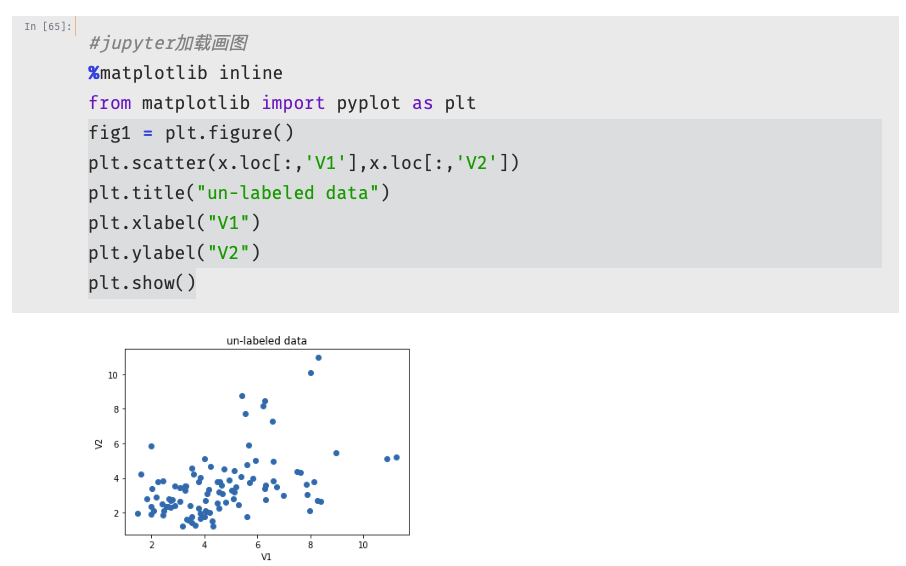
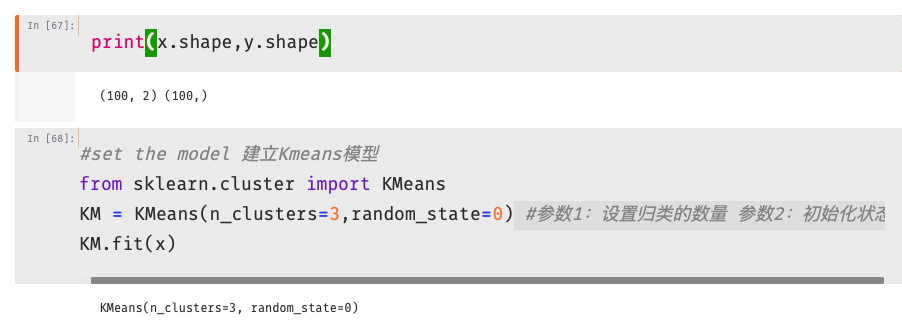
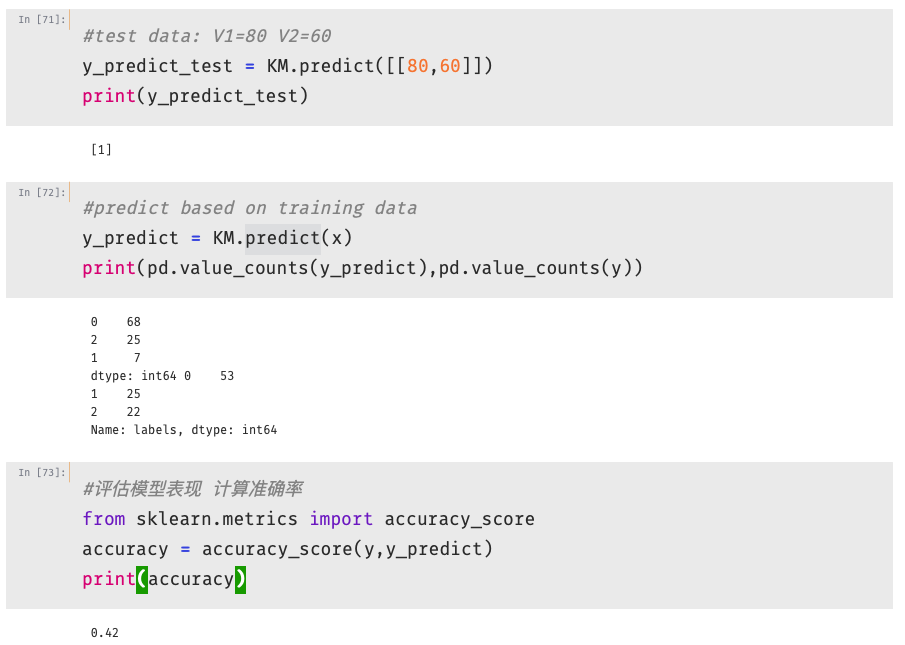
- Kmeans 实战

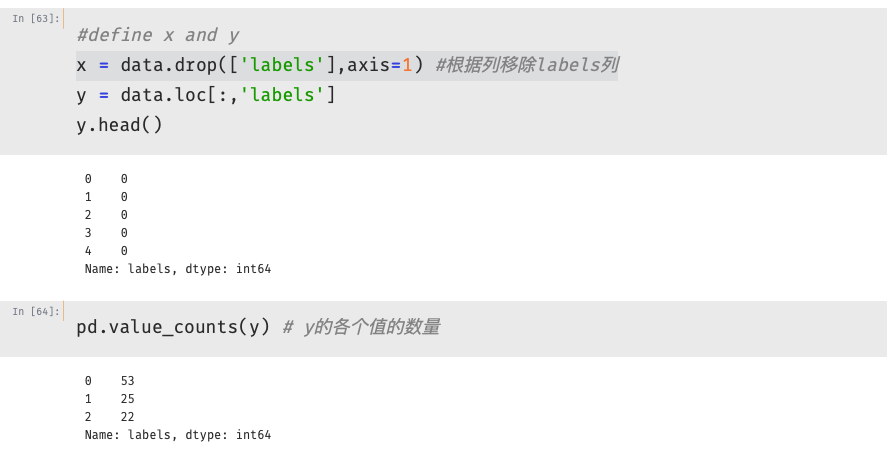
文件:data.csv 内容:


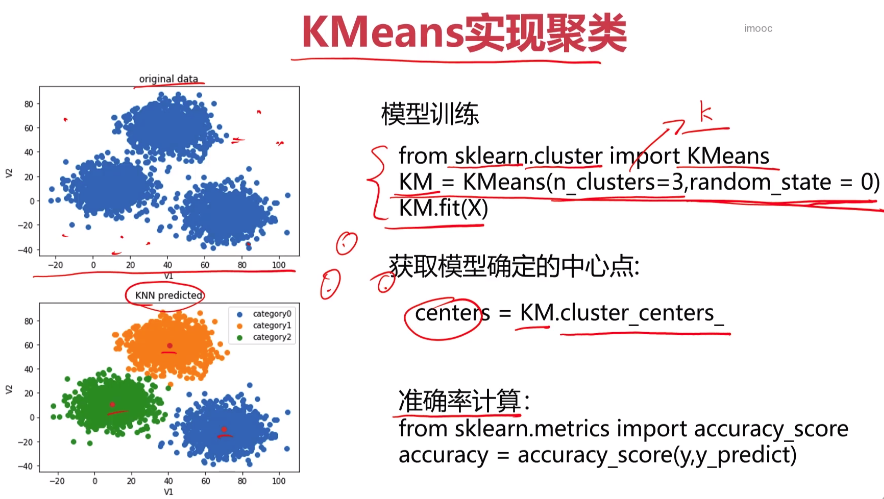
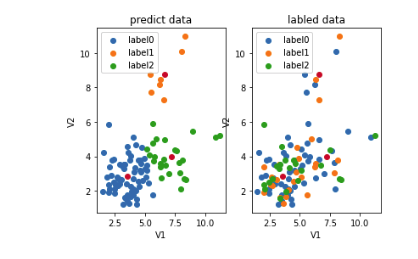
 1 #visualize the data and results
 2 #预测数据
 3 fig4 = plt.subplot(121) #一行两列中 在第一行中画图
 4 label0 = plt.scatter(x.loc[:,'V1'][y_predict==0],x.loc[:,'V2'][y_predict==0])
 5 label1 = plt.scatter(x.loc[:,'V1'][y_predict==1],x.loc[:,'V2'][y_predict==1])
 6 label2 = plt.scatter(x.loc[:,'V1'][y_predict==2],x.loc[:,'V2'][y_predict==2])
 7
 8 plt.title("predict data")
 9 plt.xlabel("V1")
10 plt.ylabel("V2")
11 plt.legend((label0,label1,label2),('label0','label1','label2'))#题注:将数据分类并设置分类的名称
12
13 plt.scatter(centers[:,0],centers[:,1])#根据数据表格的第一列与第二列找到中心点
14
15 #原始数据
16 fig5 = plt.subplot(122) #一行两列中 在第二行中画图
17 label0 = plt.scatter(x.loc[:,'V1'][y==0],x.loc[:,'V2'][y==0])
18 label1 = plt.scatter(x.loc[:,'V1'][y==1],x.loc[:,'V2'][y==1])
19 label2 = plt.scatter(x.loc[:,'V1'][y==2],x.loc[:,'V2'][y==2])
20
21 plt.title("labled data")
22 plt.xlabel("V1")
23 plt.ylabel("V2")
24 plt.legend((label0,label1,label2),('label0','label1','label2'))#题注:将数据分类并设置分类的名称
25
26 plt.scatter(centers[:,0],centers[:,1])#根据数据表格的第一列与第二列找到中心点
27
28 plt.show()
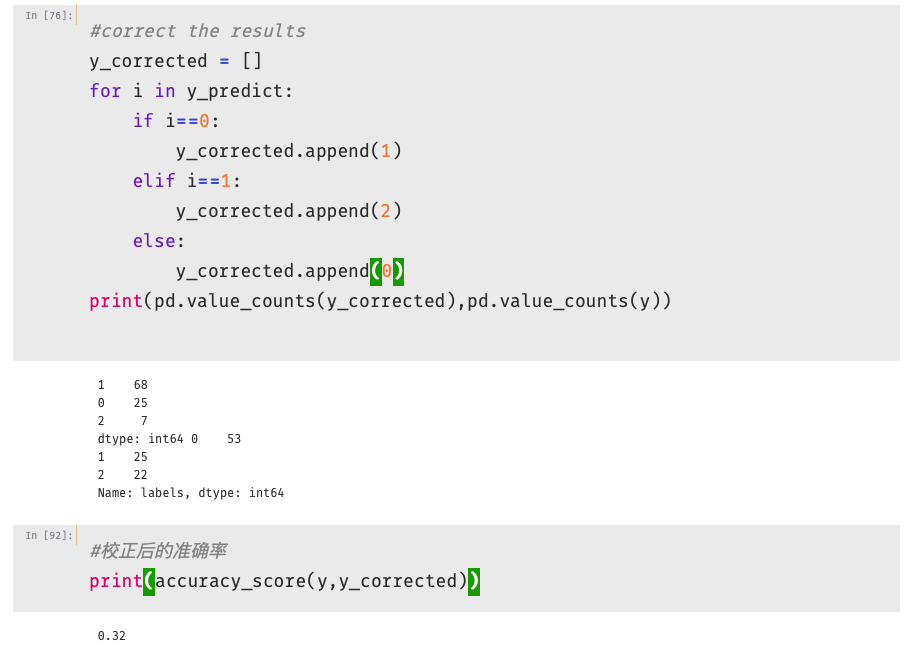

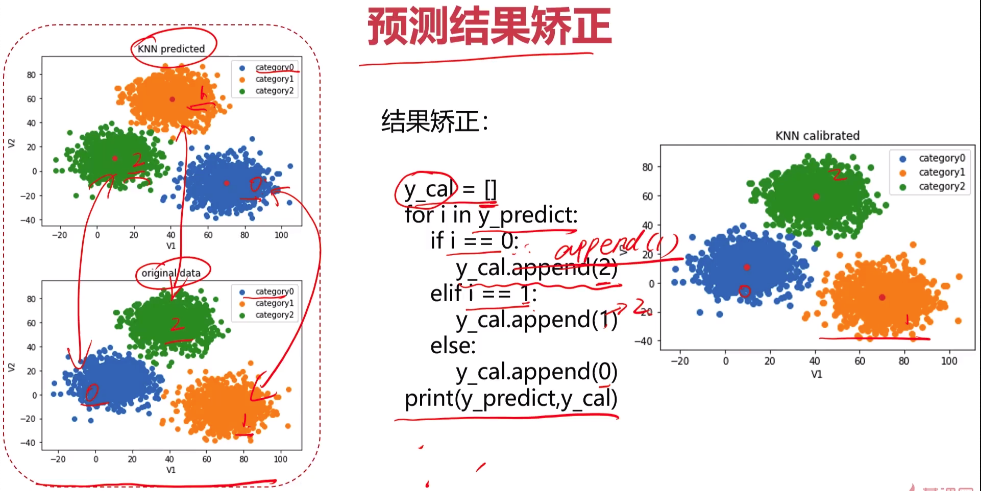
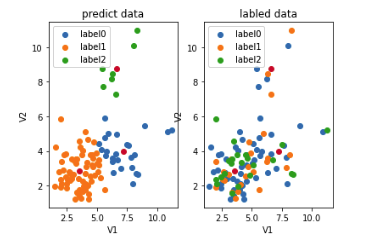
 1 #visualize the data and results (校正后的数据)
 2 #预测数据
 3 fig4 = plt.subplot(121) #一行两列中 在第一行中画图
 4 label0 = plt.scatter(x.loc[:,'V1'][y_corrected==0],x.loc[:,'V2'][y_corrected==0])
 5 label1 = plt.scatter(x.loc[:,'V1'][y_corrected==1],x.loc[:,'V2'][y_corrected==1])
 6 label2 = plt.scatter(x.loc[:,'V1'][y_corrected==2],x.loc[:,'V2'][y_corrected==2])
 7
 8 plt.title("predict data")
 9 plt.xlabel("V1")
10 plt.ylabel("V2")
11 plt.legend((label0,label1,label2),('label0','label1','label2'))#题注:将数据分类并设置分类的名称
12
13 plt.scatter(centers[:,0],centers[:,1])#根据数据表格的第一列与第二列找到中心点
14
15 #原始数据
16 fig5 = plt.subplot(122) #一行两列中 在第二行中画图
17 label0 = plt.scatter(x.loc[:,'V1'][y==0],x.loc[:,'V2'][y==0])
18 label1 = plt.scatter(x.loc[:,'V1'][y==1],x.loc[:,'V2'][y==1])
19 label2 = plt.scatter(x.loc[:,'V1'][y==2],x.loc[:,'V2'][y==2])
20
21 plt.title("labled data")
22 plt.xlabel("V1")
23 plt.ylabel("V2")
24 plt.legend((label0,label1,label2),('label0','label1','label2'))#题注:将数据分类并设置分类的名称
25
26 plt.scatter(centers[:,0],centers[:,1])#根据数据表格的第一列与第二列找到中心点
27
28 plt.show()
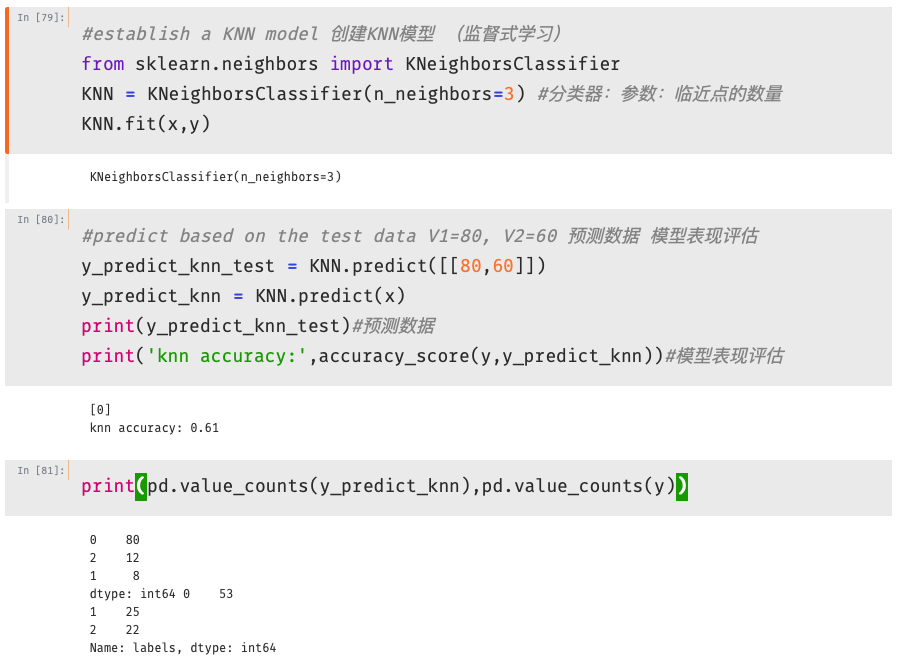
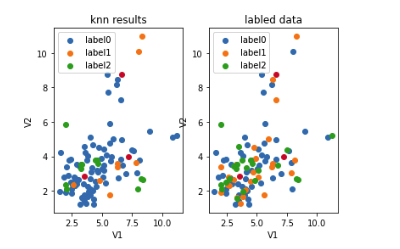
 1 #visualize the data and results (KNN数据)
 2 #预测数据
 3 fig6 = plt.subplot(121) #一行两列中 在第一行中画图
 4 label0 = plt.scatter(x.loc[:,'V1'][y_predict_knn==0],x.loc[:,'V2'][y_predict_knn==0])
 5 label1 = plt.scatter(x.loc[:,'V1'][y_predict_knn==1],x.loc[:,'V2'][y_predict_knn==1])
 6 label2 = plt.scatter(x.loc[:,'V1'][y_predict_knn==2],x.loc[:,'V2'][y_predict_knn==2])
 7
 8 plt.title("knn results")
 9 plt.xlabel("V1")
10 plt.ylabel("V2")
11 plt.legend((label0,label1,label2),('label0','label1','label2'))#题注:将数据分类并设置分类的名称
12
13 plt.scatter(centers[:,0],centers[:,1])#根据数据表格的第一列与第二列找到中心点
14
15 #原始数据
16 fig7 = plt.subplot(122) #一行两列中 在第二行中画图
17 label0 = plt.scatter(x.loc[:,'V1'][y==0],x.loc[:,'V2'][y==0])
18 label1 = plt.scatter(x.loc[:,'V1'][y==1],x.loc[:,'V2'][y==1])
19 label2 = plt.scatter(x.loc[:,'V1'][y==2],x.loc[:,'V2'][y==2])
20
21 plt.title("labled data")
22 plt.xlabel("V1")
23 plt.ylabel("V2")
24 plt.legend((label0,label1,label2),('label0','label1','label2'))#题注:将数据分类并设置分类的名称
25
26 plt.scatter(centers[:,0],centers[:,1])#根据数据表格的第一列与第二列找到中心点
27
28 plt.show()

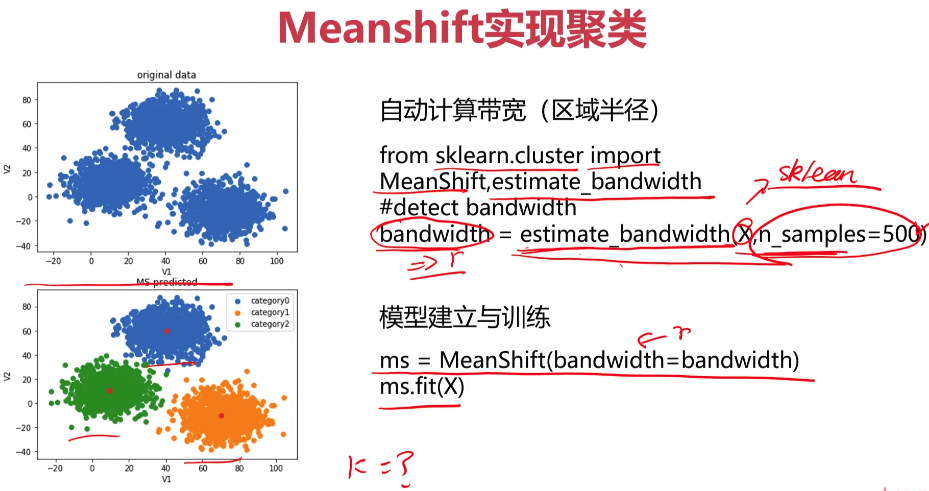
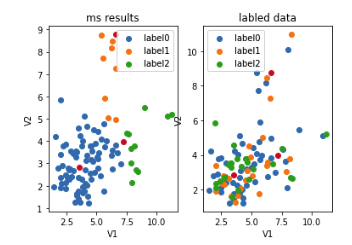
 1 #visualize the data and results (Mshift的数据)
 2 #预测数据
 3 fig6 = plt.subplot(121) #一行两列中 在第一行中画图
 4 label0 = plt.scatter(x.loc[:,'V1'][y_predict_ms==0],x.loc[:,'V2'][y_predict_ms==0])
 5 label1 = plt.scatter(x.loc[:,'V1'][y_predict_ms==1],x.loc[:,'V2'][y_predict_ms==1])
 6 label2 = plt.scatter(x.loc[:,'V1'][y_predict_ms==2],x.loc[:,'V2'][y_predict_ms==2])
 7
 8 plt.title("ms results")
 9 plt.xlabel("V1")
10 plt.ylabel("V2")
11 plt.legend((label0,label1,label2),('label0','label1','label2'))#题注:将数据分类并设置分类的名称
12
13 plt.scatter(centers[:,0],centers[:,1])#根据数据表格的第一列与第二列找到中心点
14
15 #原始数据
16 fig7 = plt.subplot(122) #一行两列中 在第二行中画图
17 label0 = plt.scatter(x.loc[:,'V1'][y==0],x.loc[:,'V2'][y==0])
18 label1 = plt.scatter(x.loc[:,'V1'][y==1],x.loc[:,'V2'][y==1])
19 label2 = plt.scatter(x.loc[:,'V1'][y==2],x.loc[:,'V2'][y==2])
20
21 plt.title("labled data")
22 plt.xlabel("V1")
23 plt.ylabel("V2")
24 plt.legend((label0,label1,label2),('label0','label1','label2'))#题注:将数据分类并设置分类的名称
25
26 plt.scatter(centers[:,0],centers[:,1])#根据数据表格的第一列与第二列找到中心点
27
28 plt.show()

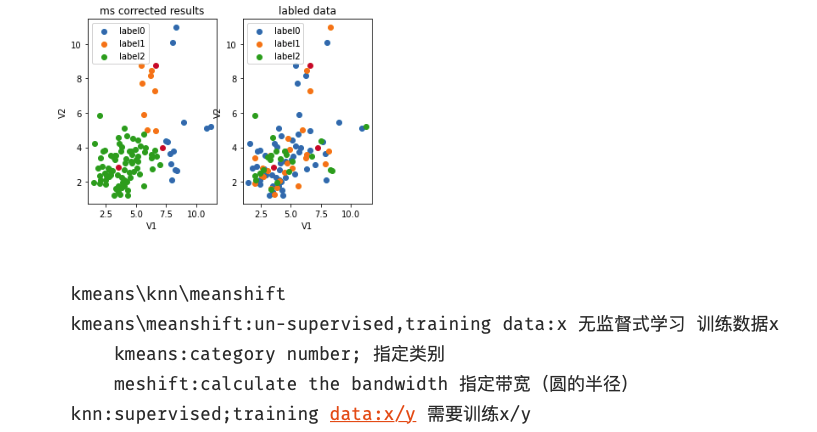
 1 #visualize the data and results (Mshift 校正后的数据)
 2 #预测数据
 3 fig6 = plt.subplot(121) #一行两列中 在第一行中画图
 4 label0 = plt.scatter(x.loc[:,'V1'][y_corrected_ms==0],x.loc[:,'V2'][y_corrected_ms==0])
 5 label1 = plt.scatter(x.loc[:,'V1'][y_corrected_ms==1],x.loc[:,'V2'][y_corrected_ms==1])
 6 label2 = plt.scatter(x.loc[:,'V1'][y_corrected_ms==2],x.loc[:,'V2'][y_corrected_ms==2])
 7
 8 plt.title("ms corrected results")
 9 plt.xlabel("V1")
10 plt.ylabel("V2")
11 plt.legend((label0,label1,label2),('label0','label1','label2'))#题注:将数据分类并设置分类的名称
12
13 plt.scatter(centers[:,0],centers[:,1])#根据数据表格的第一列与第二列找到中心点
14
15 #原始数据
16 fig7 = plt.subplot(122) #一行两列中 在第二行中画图
17 label0 = plt.scatter(x.loc[:,'V1'][y==0],x.loc[:,'V2'][y==0])
18 label1 = plt.scatter(x.loc[:,'V1'][y==1],x.loc[:,'V2'][y==1])
19 label2 = plt.scatter(x.loc[:,'V1'][y==2],x.loc[:,'V2'][y==2])
20
21 plt.title("labled data")
22 plt.xlabel("V1")
23 plt.ylabel("V2")
24 plt.legend((label0,label1,label2),('label0','label1','label2'))#题注:将数据分类并设置分类的名称
25
26 plt.scatter(centers[:,0],centers[:,1])#根据数据表格的第一列与第二列找到中心点
27
28 plt.show()