#导入工具包
import numpy as np
import cv2
import matplotlib.pyplot as plt
# 定义显示图片
def show(image):
    plt.imshow(image)
    plt.axis('off')
    plt.show()
# numpy生成颜色黑色图片
image = np.zeros((300,300,3),dtype='uint8')
show(image)

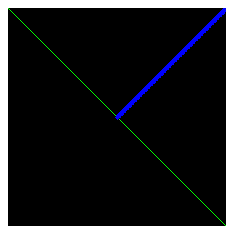
#画线
green = (0,255,0)
cv2.line(image, (0,0), (300,300), green)
show(image)

blue = (0,0,255)
cv2.line(image, (300,0), (150,150), blue, 5)
show(image)
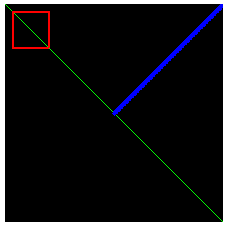
# 画矩形
red = (255,0,0)
cv2.rectangle(image, (10,10), (60,60), red, 2)
show(image)
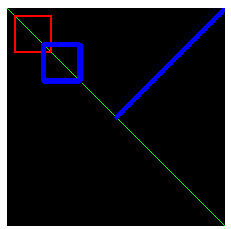
1 cv2.rectangle(image, (50,50), (100,100), blue, 5)
2 show(image)
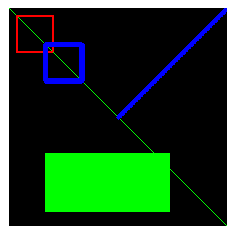
cv2.rectangle(image, (50,200), (220,280), green, -1)
show(image)
# 画圆
image = np.zeros((300,300,3),dtype='uint8')
(cX, cY) = image.shape[1]//2, image.shape[0]//2
white = (255,255,255)
for r in range(0,151,15):
    cv2.circle(image, (cX,cY), r, white, 2)
show(image)

image = np.zeros((300,300,3),dtype='uint8')
for i in range(10):
    # 半径取值
    radius = np.random.randint(5,200)
    # 颜色取值
    color = np.random.randint(0,255,size=(3,)).tolist()
    # 圆心取值
    pt = np.random.randint(0,300,size=(2,))
    # 画图
    cv2.circle(image, tuple(pt), radius, color, -1)
show(image)