1、free
[root@PC3 /]# free
             total       used       free     shared    buffers     cached
Mem:       8162676    7297800     864876       9584         32    6237016
-/+ buffers/cache:    1060752    7101924
Swap:      8273916        212    8273704
[root@PC3 /]# free -m
             total       used       free     shared    buffers     cached
Mem:          7971       7126        844          9          0       6090
-/+ buffers/cache:       1035       6935
Swap:         8079          0       8079
[root@PC3 /]# free -h
             total       used       free     shared    buffers     cached
Mem:          7.8G       7.0G       844M       9.4M        32K       5.9G
-/+ buffers/cache:       1.0G       6.8G
Swap:         7.9G       212K       7.9G
以上三个命令结果一样,只是显示的单位不同。
以free -h为例。
mem total: 7.8G 总的物理内存大小。
mem used:这里并不是说已经使用的内存大小,而是现在系统内核控制的内存数, 这里包含实际使用的和缓存的。
mem free: 这里的free指的是内核还未纳入其管控范围的数量。
shared: 共享的内存数量。
buffers: 缓存的内存数量。
cached:缓存的内存数量。
实际剩余可以使用的内存为: free + buffers + cached = 844M + 32K + 5.9G。
swap total:交换分区总的大小。
swap used:已经使用的交换分区大小。监测的时候需要重点关注,如果swap频繁改变,表示系统已经在使用交换分区,也就是说此时物理内存不足。
swap free:剩余的交换分区大小。
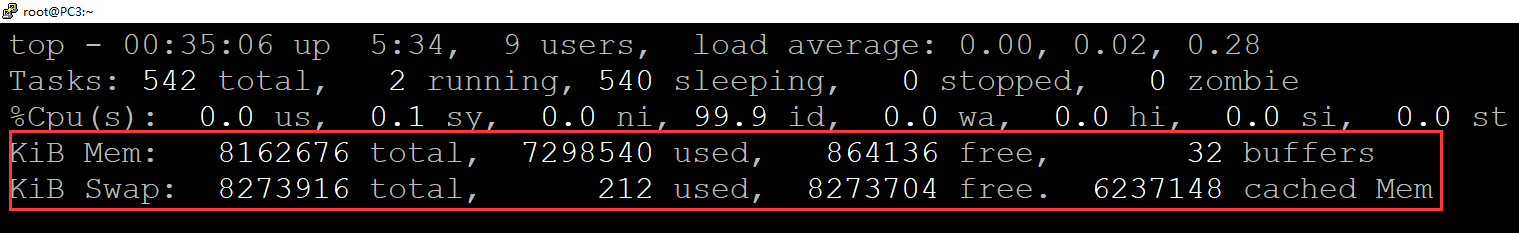
2、top
top命令的第4、5行基本等价于free命令
3、查出系统中消耗内存最多的程序
[root@PC3 /]# cat <(ps aux | head -1) <(ps aux | grep -v PID | sort -rn -k +4 |head)
USER        PID %CPU %MEM    VSZ   RSS TTY      STAT START   TIME COMMAND
root       6997  183 16.3 1591180 1335932 pts/2 Sl+  00:38  45:38 fastp --thread 1 -i test3_1_clean.fq.gz -I test3_2_clean.fq.gz -o our.R1.fq.gz -O out.R2.fq.gz
root       2547  0.9  4.4 2083028 360828 ?      Sl   Jul23   3:30 /usr/bin/gnome-shell
root       1386  0.0  0.6 281780 56016 tty1     Ssl+ Jul23   0:06 /usr/bin/Xorg :0 -background none -verbose -auth /run/gdm/auth-for-gdm-CBn3PU/database -seat seat0 -nolisten tcp vt1
root       7413  6.7  0.4 160232 36376 pts/5    D+   00:56   0:28 sort result.ped
root       1153  0.0  0.2 327348 18388 ?        Ssl  Jul23   0:00 /usr/bin/python -Es /usr/sbin/firewalld --nofork --nopid
root       2685  0.0  0.1 603208  8692 ?        SNl  Jul23   0:00 /usr/libexec/tracker-miner-fs
root       2668  0.0  0.1 448324  9644 ?        Sl   Jul23   0:00 abrt-applet
root       2665  0.0  0.1 424748  8912 ?        Sl   Jul23   0:00 /usr/libexec/tracker-store
root       2657  0.0  0.1 890728 11048 ?        Sl   Jul23   0:00 /usr/libexec/evolution-calendar-factory
root       2614  0.0  0.1 982960 13144 ?        Sl   Jul23   0:00 /usr/bin/nautilus --no-default-window