1、
setwd("C:/Users/75377/Desktop/SHEEP_ROH")
png("12.png",width = 7000,height = 5500,pointsize = 170)
par(mai = c(12,12,12,12),mgp = c(2.1,0.5,0))
#地图数据下载http://cos.name/wp-content/uploads/2009/07/chinaprovinceborderdata_tar_gz.zip
library(maptools)
x <- readShapePoly ( 'bou2_4p.shp' )
plot(x,xlim=c(70,138),ylim = c(25, 45), lwd = 12,
,panel.first = grid(lwd=10))
axis(1,lwd=20,font = 2,cex.axis=1.3,tcl=-0.3)
axis(2,lwd=20,font = 2,cex.axis=1.3,tcl=-0.3)
axis(3,lwd=20,font = 2,cex.axis=1.3,tcl=-0.3)
axis(4,lwd=20,font = 2,cex.axis=1.3,tcl=-0.3)
box(which = "plot",lwd=20)
library(REmap)
options(remap.ak = "个人秘钥")
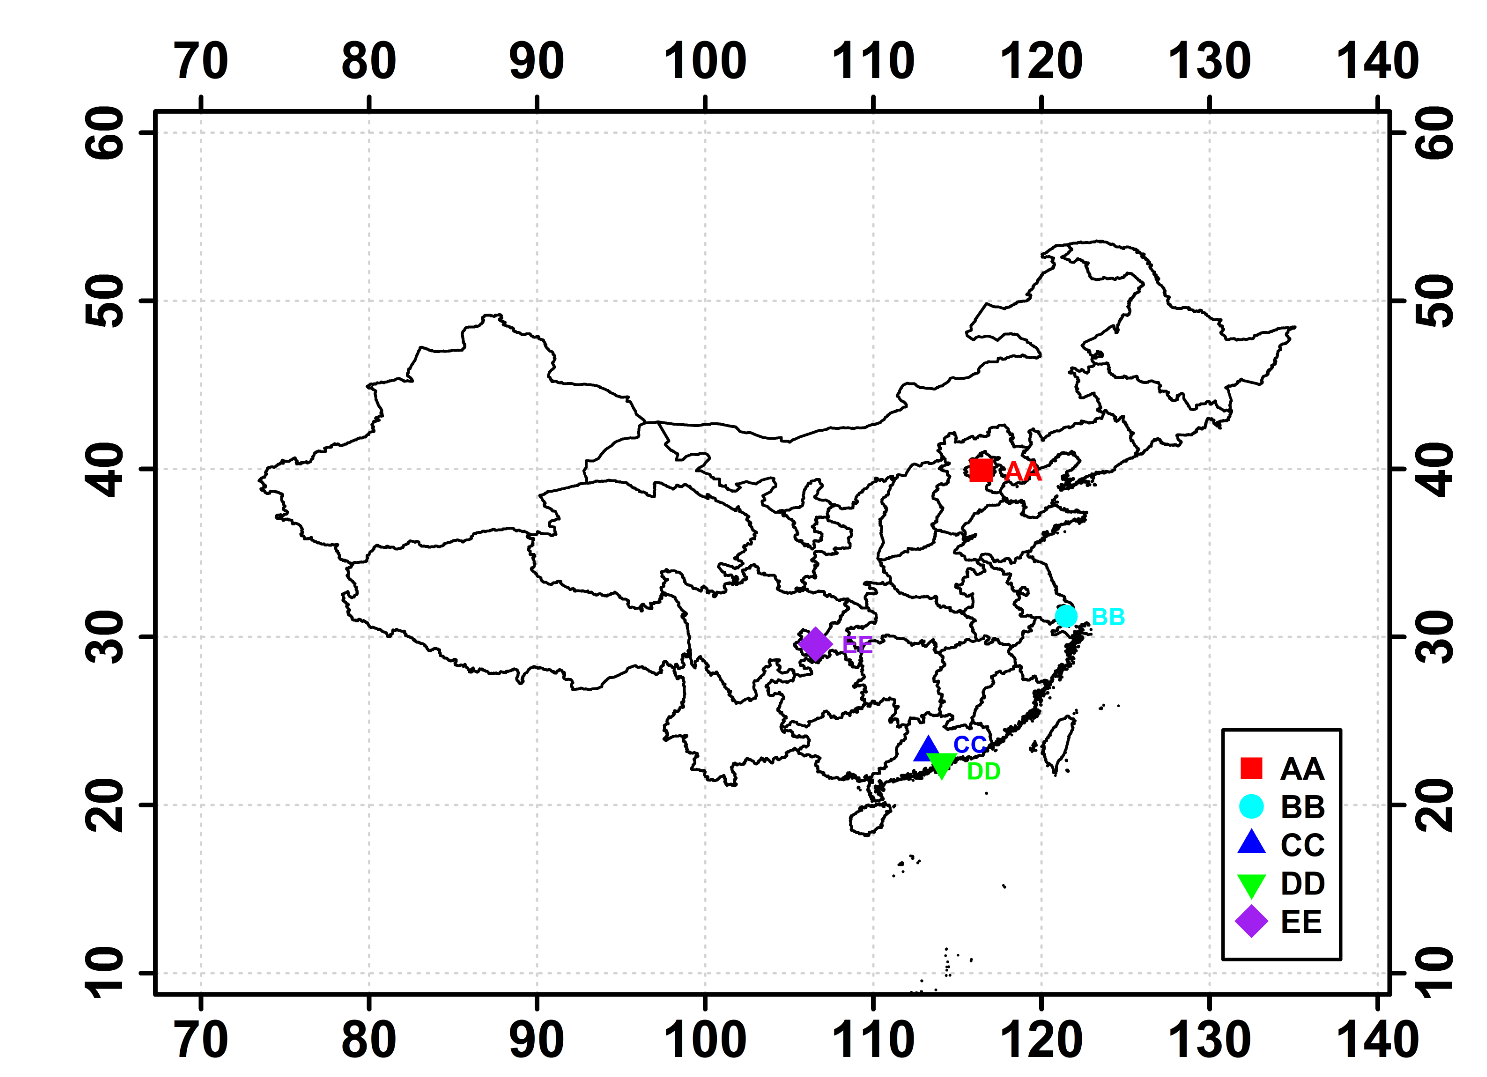
city_vec = c("北京","上海","广州","深圳","重庆")
pos <- get_geo_position (city_vec)
pos
points(pos$lon,pos$lat, pch= c(15,16,17,25,18),bg = "green",
cex=c(1.3,1.3,1.3,1.3,2),
col=c("red","cyan","blue","green","purple"))
pos$lon <- as.numeric(pos$lon)
pos$lat <- as.numeric(pos$lat)
text(x = pos$lon[1]+2.5, y = pos$lat[1], labels = "AA",
font = 2,col="red",cex=0.7)
text(x = pos$lon[2]+2.5, y = pos$lat[2], labels = "BB",
font = 2,col = "cyan",cex = 0.6)
text(x = pos$lon[3]+2.5, y = pos$lat[3]+0.5, labels = "CC",
font = 2,cex = 0.6,col = "blue")
text(x = pos$lon[4]+2.5, y = pos$lat[4]-0.5, labels = "DD",
font = 2,cex=0.6,col = "green")
text(x = pos$lon[5]+2.5, y = pos$lat[5], labels = "EE",
font = 2,cex=0.6,col = "purple")
legend("bottomright",c("AA","BB","CC","DD","EE"),inset = 0.04,
pch = c(15,16,17,25,18),cex=0.8,text.font = 2,
col=c("red","cyan","blue","green","purple"),
pt.bg ="green",box.lwd =15,pt.cex = c(1.2,1.4,1.2,1.2,1.9))
dev.off()