前几天从php7.0.x 升级到了php7.2.0版本, 结果装xhprof没有找到能支持对应版本的xhprof
于是又安装了一个php7.1.2的版本(brew install h)
接着安装xhprof扩展
git clone https://github.com/longxinH/xhprof
cd xhprof/extension/
/usr/local/bin/phpize
./configure --with-php-config=/usr/local/bin//php-config
make && sudo make install
启用扩展
vim /usr/local/etc/php/7.1/php.in

最后引入扩展,并自定义输出目录
[xhprof]
extension = xhprof.so
xhprof.output_dir = /Users/liugx/work/php/xhprof
将 上面下载的 xhprof 文件夹中的这两个目录复制一份到 /Users/liugx/work/php/xhprof 目录下
cd ..
cp -r xhprof_lib/ /Users/liugx/work/php/xhprof/xhprof_lib/
cp -r xhprof_html/ /Users/liugx/work/php/xhprof/xhprof_html/
并在/Users/liugx/work/php/xhprof根目录下添加文件 inject.php,如下:
<?php
/**
 * User: szliugx@gmail.com
 * Date: 17/12/20
 * Time: 上午11:32
 */

//开启xhprof
xhprof_enable(XHPROF_FLAGS_MEMORY | XHPROF_FLAGS_CPU);

//在程序结束后收集数据
register_shutdown_function(function() {
    $xhprof_data   = xhprof_disable();

    //让数据收集程序在后台运行
    if (function_exists('fastcgi_finish_request')) {
        fastcgi_finish_request();
    }

    //保存xhprof数据
    $XHPROF_ROOT = '/Users/liugx/work/php/xhprof';
    include_once $XHPROF_ROOT . "/xhprof_lib/utils/xhprof_lib.php";
    include_once $XHPROF_ROOT . "/xhprof_lib/utils/xhprof_runs.php";
    // save raw data for this profiler run using default
    // implementation of iXHProfRuns.
    $xhprof_runs = new XHProfRuns_Default();
    // save the run under a namespace "xhprof_foo"
    $run_id = $xhprof_runs->save_run($xhprof_data, "xhprof_foo");
    echo $run_id;
});
将 /Users/liugx/work/php/xhprof 目录设置称web站点,监控站点nginx配置
server {
       listen 80;
       server_name xhprof-view.com;

       #root  /Users/liugx/work/php/xhprof;

        location / {
            root   /Users/liugx/work/php/xhprof;
            #try_files $uri $uri/ /index.php?$query_string;
            index  index.php index.html index.htm;
        }

        # pass the PHP scripts to FastCGI server listening on 127.0.0.1:9000
        #
        location ~ .php$ {
            root           /Users/liugx/work/php/xhprof;
            fastcgi_pass   127.0.0.1:9000;
            fastcgi_index  index.php;
            fastcgi_param  SCRIPT_FILENAME  /scripts$fastcgi_script_name;
            fastcgi_param  SCRIPT_FILENAME  $document_root$fastcgi_script_name;
            #fastcgi_param PHP_VALUE "auto_prepend_file=/Users/liugx/work/php/xhprof/inject.php"; #(此配置文件中不用加,需要监控哪个站点加上这一行就行)
            include        fastcgi_params;
        }
}
### ⚠ 这样监控站点和被监控站点的配置(被监控站点nginx配置只需要加一行代码
fastcgi_param PHP_VALUE "auto_prepend_file=/Users/liugx/work/php/xhprof/inject.php";
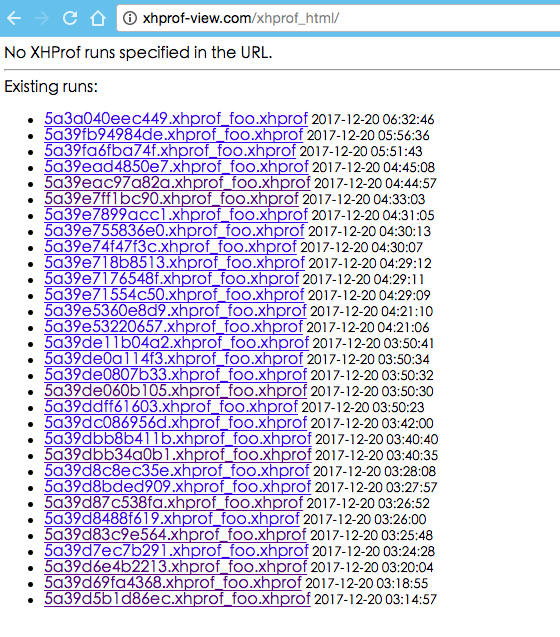
)就完了,重启php-fpm和nginx,访问被监控站点,访问http://xhprof-view.com/xhprof_html/ 就能得到一些监控信息列表,如下:
然后点击一条详情,输出如下:
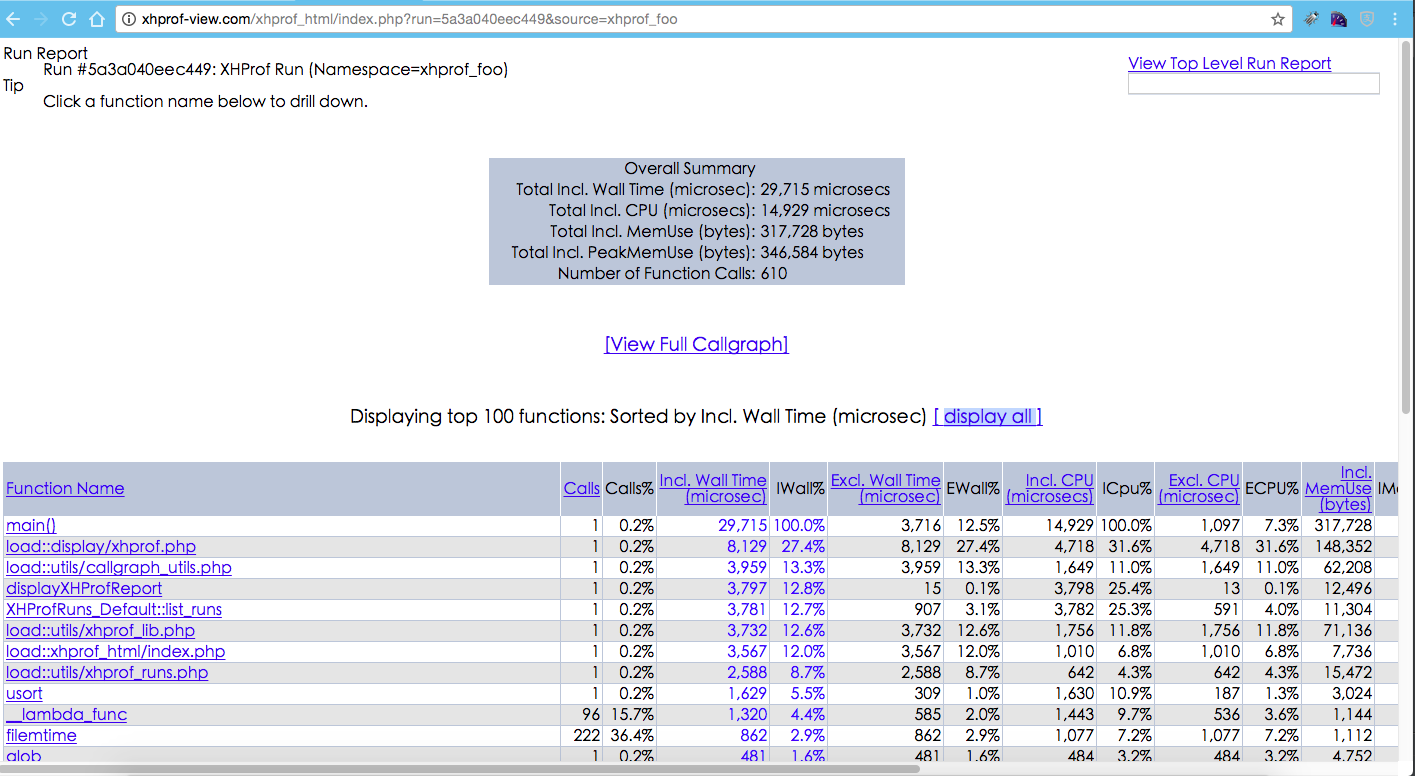
展示详细的硬件消耗和时间消耗信息,如果想更直观的看,可以已图片的形式看调用过程情况,点击页面中的 [View Full Callgraph]
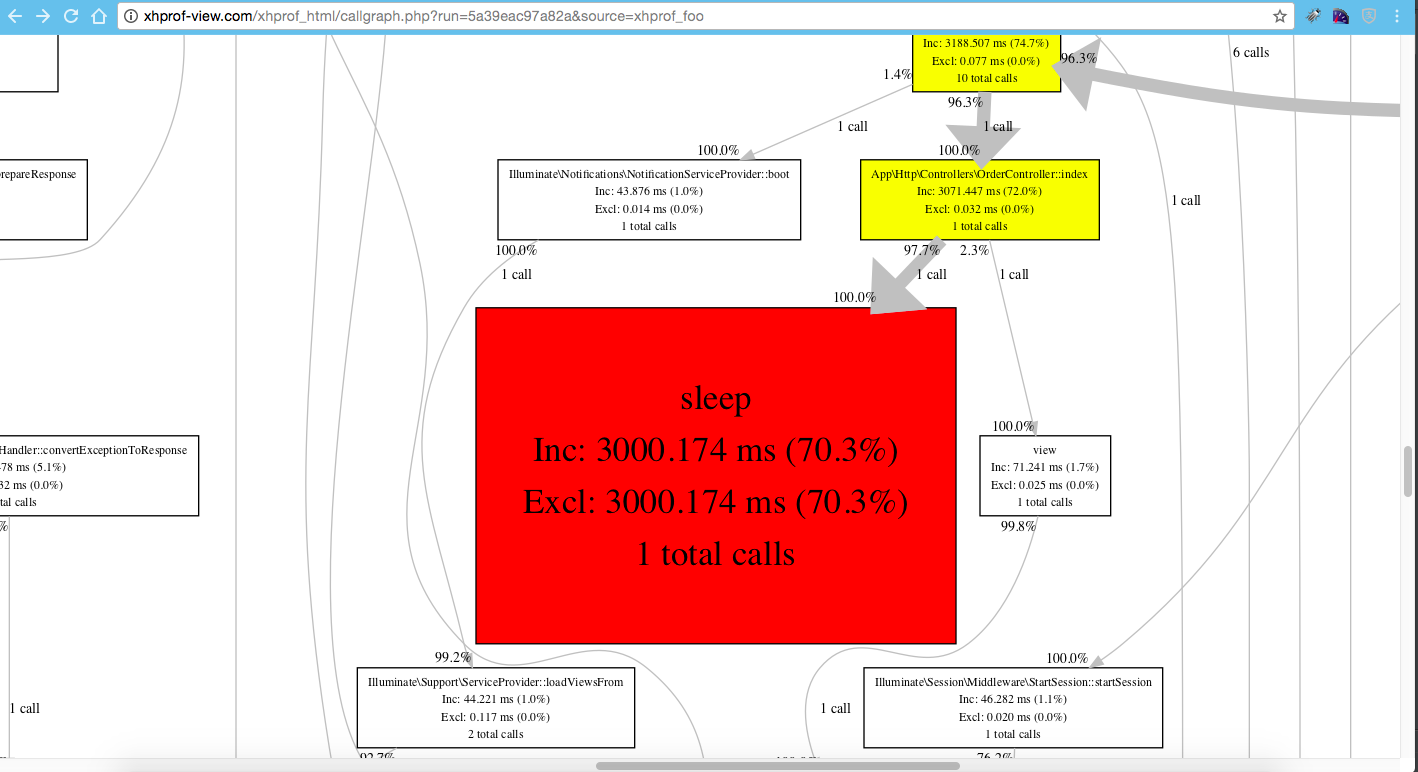
红色区域就是耗时最多的地方,但是这个功能需要安装 Graphviz
一开始准备直接 brew install graphviz,结果失败了,因为安装时,里面有个依赖webp是Google的源
于是上http://graphviz.org/download/官网,介绍还可以MacPorts 方式安装,这次安装成功了
先下载安装MacPorts,找到系统对应的版本
http://distfiles.macports.org/MacPorts/MacPorts-2.4.0-10.10-Yosemite.pkg
下载安装完后,终端执行
sudo port -v selfupdate
sudo port install graphviz
安装完后,如下说明安装成功并且执行文件已经加入了环境变量
liugx@liugx ~$ dot -V
dot - graphviz version 2.40.1 (20161225.0304)
这时,如果点击[View Full Callgraph]如果还是出现,mac sh: dot: command not found 这样的信息,直接改/Users/liugx/work/php/xhprof/xhprof_lib/utils/callgraph_utils.php
中的
$cmd = " dot -T".$type; 改成 $cmd = " /opt/local/bin/dot -T".$type; 相当于给了绝对路径,不怕找错地方(此方法不推荐)
我是直接建了个链接从原文件到目标文件
ln /opt/local/bin/dot /usr/local/bin/dot