今天大意了解了一下leaflet这个开源的 JavaScript 库,很强大。
结合腾讯地图,做了个简单的demo,作为一个学习的起点吧(各种API结合自身的业务)
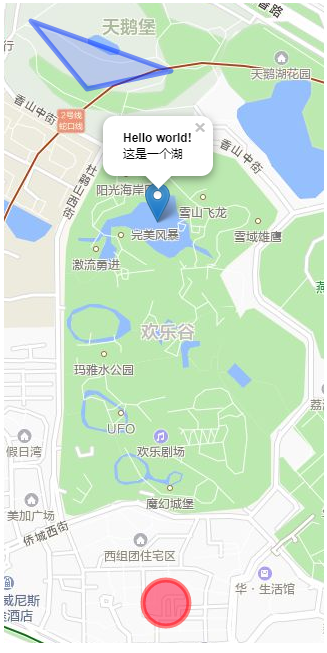
<!DOCTYPE html> <html> <head> <title>map</title> </head> <link rel="stylesheet" href="http://cdn.leafletjs.com/leaflet-0.7.3/leaflet.css" /> <script src="http://cdn.leafletjs.com/leaflet-0.7.3/leaflet.js"></script> <style type="text/css"> /*确定map容器的高度,宽度*/ #map { height: 640px; width: 320px; } </style> <body> <!-- 地图容器 --> <div id="map"></div> <script type="text/javascript"> //加载gis地图 var southWest = [22.53491493,113.96075249],//地图西南点坐标 northEast = [22.5587753,113.99362564],//地图东北点坐标 bounds = L.latLngBounds(southWest, northEast);//地图边界 //####设置地图设置地图中心和缩放级别 var map = L.map('map',{ zoomControl: false, //隐藏默认缩放按钮 attributionControl: false,//隐藏copyright //center: new L.LatLng("22.54185077705975", "113.9806441116333"),//加载地图的中心点 //zoom: "16",//默认显示层级 maxBounds: bounds,//地图的边界 maxZoom:"20",//最大显示层级 minZoom:"1",//最小显示层级 attribution: 'Map data © <a href="http://www.cnblogs.com/liugx/p/7651379.html">szliugx</a>',//添加copyright,无效(已经禁用) }).setView(["22.54185077705975", "113.9806441116333"], 16);//默认显示16层级,设置默认加载中心点经纬度 //####添加标注、圆形、多边形 //添加标注 var marker = L.marker([22.54383, 113.98049]).addTo(map); marker.bindPopup("<b>Hello world!</b><br>这是一个湖").openPopup(); //#####添加圆形 var circle = L.circle([22.5363, 113.98069], 50, { color: 'red', fillColor: '#f03', fillOpacity: 0.5 }).addTo(map); //circle.bindPopup("这是圈圈").openPopup(); // //#####添加多边形 var polygon = L.polygon([ [22.54784, 113.97779], [22.54685, 113.98079], [22.54649, 113.97899] ]).addTo(map); //polygon.bindPopup("土豪聚集地").openPopup();; //#####添加弹出气泡 //xxx.bindPopup("xxx").openPopup();; //#####处理事件 function onMapClick(e) { alert("You clicked the map at " + e.latlng); } map.on('click', onMapClick); L.TileLayer.WebDogTileLayer = L.TileLayer.extend({ getTileUrl: function (tilePoint) { var urlArgs, getUrlArgs = this.options.getUrlArgs; if (getUrlArgs) { var urlArgs = getUrlArgs(tilePoint); } else { urlArgs = { z: tilePoint.z, x: tilePoint.x, y: tilePoint.y }; } return L.Util.template(this._url, L.extend(urlArgs, this.options, {s: this._getSubdomain(tilePoint)})); } }); L.tileLayer.webdogTileLayer = function (url, options) { return new L.TileLayer.WebDogTileLayer(url, options); }; var url = 'http://rt{s}.map.gtimg.com/realtimerender?z={z}&x={x}&y={y}&type=vector&style=0'; options = { //分布式域名前缀标识 subdomains: '012', //重写腾讯地图的瓦片图规则 getUrlArgs: function (tilePoint) { return { z: tilePoint.z, x: tilePoint.x, y: Math.pow(2, tilePoint.z) - 1 - tilePoint.y }; } }; //L.tileLayer就是矢量瓦片底图,用对应的URL上找对应的z,y,x。而s是分布式服务器快速选取。最后,tileLayer图层要addTo(map)加载在地图观察器上。 L.tileLayer.webdogTileLayer(url, options).addTo(map); </script> </body> </html>