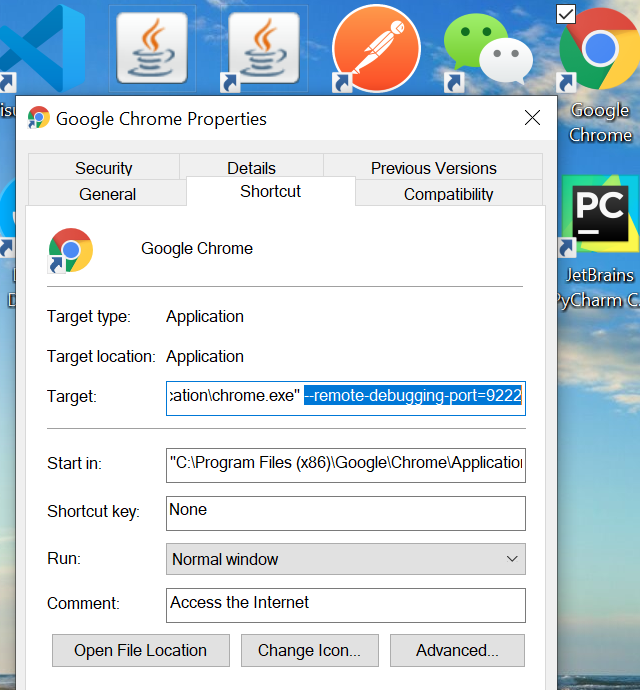
1: chrome-> 右键-> 属性,加上 --remote-debugging-port=9222
2: VS code 安装”Debugger for Chrome“

3: 左侧 调试, Attach to chrome, 在launch,json中输入如下配置: 注意标注红色的是你项目的实际地址,配置正确的端口号。
{
  // Use IntelliSense to learn about possible attributes.
  // Hover to view descriptions of existing attributes.
  // For more information, visit: https://go.microsoft.com/fwlink/?linkid=830387
  "version": "0.2.0",
  "configurations": [
    {
      "type": "chrome",
      "request": "attach",
      "name": "Attach to Chrome",
      "port": 9222,
      "webRoot": "${workspaceRoot}/src",
      "url": "http://localhost:8002/#/",
      "sourceMaps": true,
      "sourceMapPathOverrides": {
        "webpack:///src/*": "${webRoot}/*"
      }
    }
  ]
}
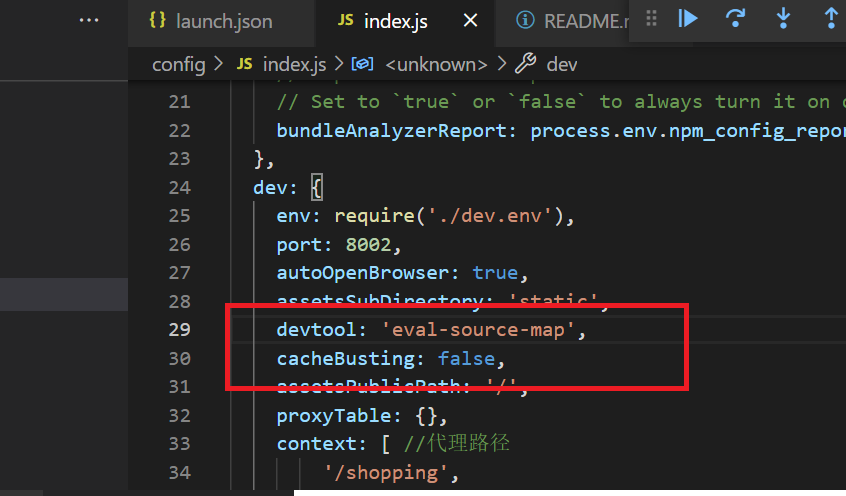
4: 在config/index.js中的dev下面填加如下两项内容:
 devtool: 'eval-source-map',
    cacheBusting: false,
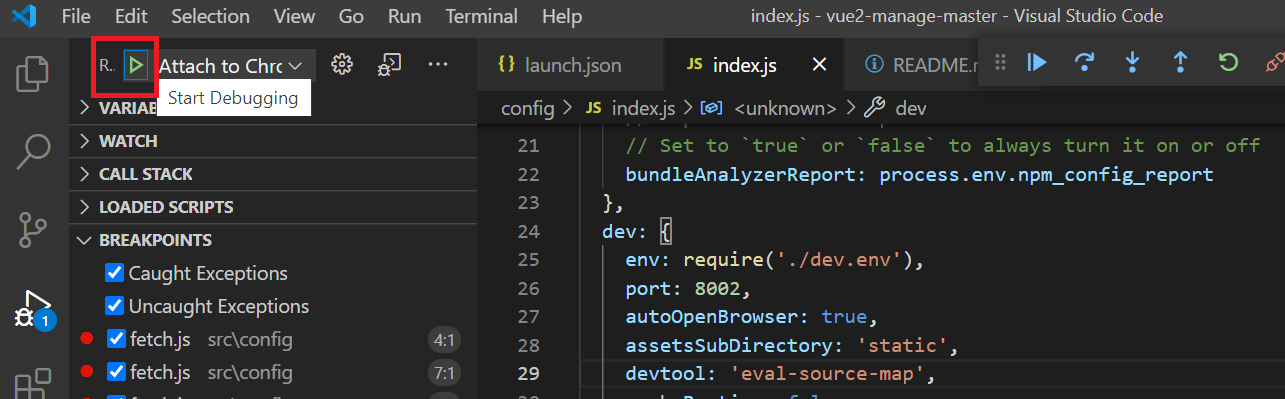
5:打开chrome, 然后NPM run dev启动你的项目, 然后点击如下的绿色三角号